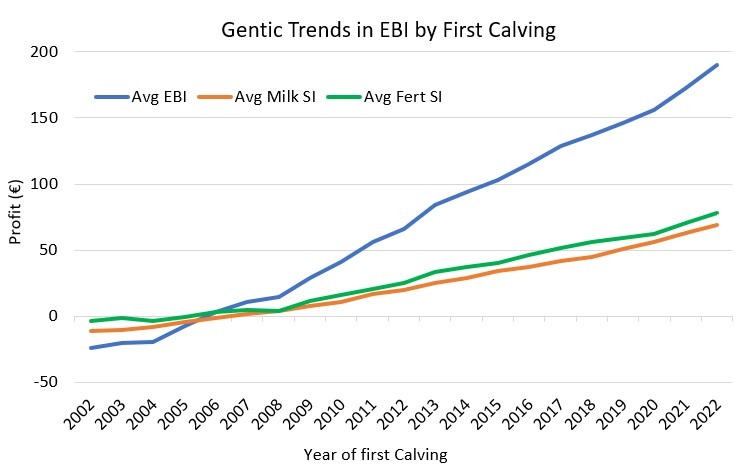
The rate of genetic gain in EBI has accelerated rapidly over the last number of years, propelled mainly by two important initiatives, the launch of the Dairy Gene Ireland breeding programme in 2005 and the introduction of genomic selection in 2009. The current annual trend in the EBI is now at €12.2/year, based on 1st parity females over the last 5 years. The nationwide increase in genetic gain has obvious benefits, most notably the increased profit per lactation. The expected EBI of 1st parity females in 2030 is expected to be €288, based on the current rate of genetic gain.
The average EBI and the sub-indexes of heifers entering the Irish dairy herd is presented in graph 1 below. The graph illustrates the rate of genetic gain that has been achieved nationally over the last 20 years. The average EBI of first calving heifers in 2022 is €214 greater than first calving heifers 20 years ago. This equates to an extra €428 per lactation for heifers calved this year, compared to the heifers of 2002.

| Dairy EBI Trends (2000-2022) | ||||||||
| Year | Avg EBI | Avg Milk SI | Avg Fert SI | Avg Calv SI | Avg Beef SI | Avg Health SI | Avg Main SI | Avg Mgt SI |
| 2000 | -21 | -15 | 3 | -4 | -6 | -8 | 14 | -2 |
| 2001 | -20 | -11 | 0 | -5 | -6 | -7 | 14 | -2 |
| 2002 | -24 | -11 | -4 | -5 | -6 | -7 | 14 | -2 |
| 2003 | -20 | -11 | -1 | -5 | -6 | -6 | 14 | -2 |
| 2004 | -19 | -8 | -3 | -4 | -6 | -6 | 14 | -2 |
| 2005 | -8 | -4 | 0 | -2 | -7 | -4 | 14 | -2 |
| 2006 | 3 | -2 | 3 | 0 | -7 | -3 | 14 | -1 |
| 2007 | 11 | 2 | 5 | 2 | -7 | -3 | 14 | -1 |
| 2008 | 15 | 4 | 4 | 3 | -7 | -2 | 14 | -1 |
| 2009 | 29 | 8 | 12 | 5 | -9 | -1 | 15 | 0 |
| 2010 | 41 | 11 | 16 | 7 | -9 | 0 | 15 | 0 |
| 2011 | 56 | 17 | 21 | 10 | -10 | 1 | 15 | 1 |
| 2012 | 66 | 20 | 25 | 13 | -10 | 1 | 14 | 1 |
| 2013 | 84 | 25 | 34 | 15 | -11 | 2 | 15 | 1 |
| 2014 | 94 | 29 | 38 | 17 | -11 | 3 | 15 | 1 |
| 2015 | 103 | 34 | 40 | 18 | -11 | 3 | 15 | 1 |
| 2016 | 115 | 37 | 47 | 20 | -12 | 4 | 15 | 2 |
| 2017 | 129 | 42 | 52 | 23 | -12 | 4 | 15 | 1 |
| 2018 | 137 | 45 | 56 | 25 | -12 | 4 | 14 | 2 |
| 2019 | 146 | 51 | 59 | 26 | -12 | 4 | 14 | 2 |
| 2020 | 156 | 56 | 62 | 30 | -12 | 3 | 13 | 2 |
| 2021 | 173 | 63 | 70 | 32 | -13 | 4 | 13 | 2 |
| 2022 | 190 | 69 | 78 | 35 | -13 | 5 | 13 | 2 |
Table 1. Dairy EBI Trends (whole dairy population) 2000-2022
