
Dairy Evaluation Results
Below is a lists of tables with proofs and related information for bulls from the most recent genetic evaluation. All proofs have been published via the central database. As usual, ranking of bulls has been based on the EBI. The files however contains more detailed information about the bulls (e.g. pedigree information). proofs for Irish bulls (with Irish AI code and daughters milking) have been separated from Foreign bulls to make it easier to search through the list. All tables contain proofs for production, linear type, calving interval and survival traits where available.
Getting proofs for Individual bulls
Searching for individual bulls is now possible for all bulls. There are options to search for bulls either by their Irish AI code (if they have one) or by the last 6 digits of their herd-book number. It is also possible to search for a bull using the name. Click here to search for individual bulls
Bull proofs for Farm Management Software Owners (March 2025)
The file with the latest proofs for AI bulls suitable for the farm management software is now available for download. To download this file, please click the right mouse button and choose the option ‘Save target as’ to download the file to a directory of your choice in your PC.
IFC Version has linear scores already multiplied by 100 (no decimal place). This includes new bull codes of length 6
=====================================================================
Bull proofs (27th May 2025)
Current Count of Records in ICBF Evaluations
What is EBI?
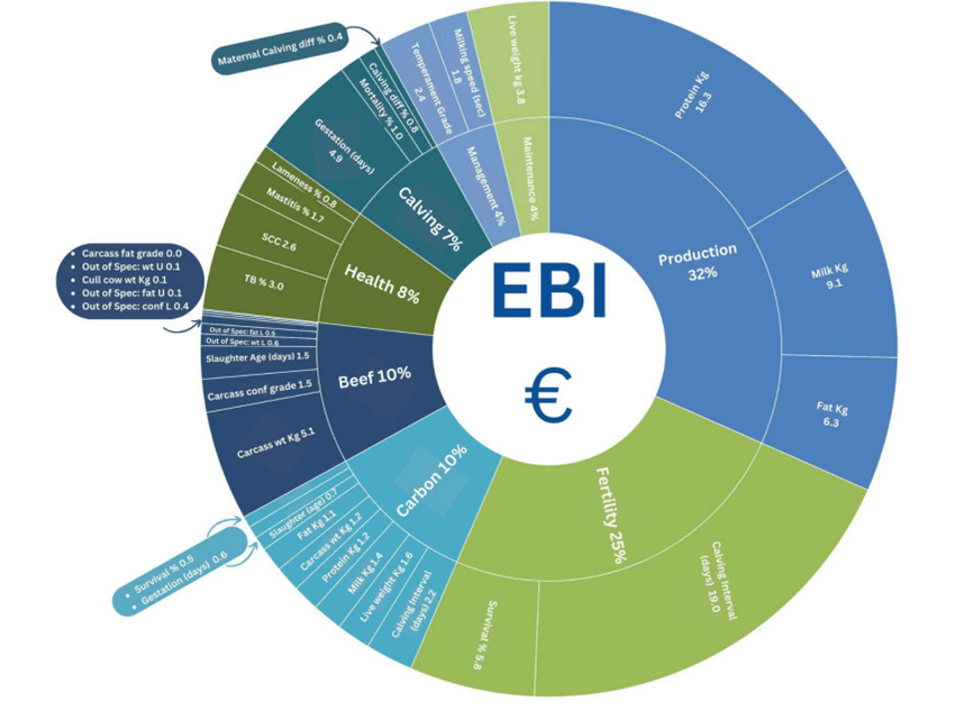
The Economic Breeding Index (EBI) is a single figure profit index aimed at helping farmers identify the most profitable bulls and cows for breeding dairy herd replacements. It comprises of information on eight sub-indexes related to profitable milk production.
- Milk Production
- Fertility
- Calving Performance
- Beef Carcass
- Carbon
- Health
- Maintenance
- Management
Milk production and fertility are the two most valuable indexes. For example, the milk sub-index constitutes 32% of the EBI. Different traits measure each sub-index, and these traits are multiplied by economic values to generate a Euro value. These Euro values are then summed to generate an overall EBI figure.
To understand more about the sub-indexes of the EBI click here: Interpreting EBI for Genetic Advancement – ICBF
What does PTA mean?
- PTA stands for ‘Predicted Transmitting Ability‘. It tells us how much of a trait—like milk yield or fertility—a cow is likely to pass on to her calves.
- Just like people inherit traits from their parents, calves inherit traits from their mother and father. The PTA helps farmers predict how good a cow’s offspring will be in terms of specific traits.
- Every animal has a genetic potential, called a breeding value. Since a cow only passes on half of her genes to her calves, we use half of the breeding value—and that’s the PTA (the expected difference between the offspring of that animal and the base cow)
- PTAs are based on the cow’s genetics and are compared to a “base cow,” which has an Economic Breeding Index (EBI) of €0.
What is the Base Cow?
To make comparisons fair, all animals are compared to the same “base cow,” which is a real group of cows used as a reference point. These cows have a PTA of zero. So when you see a PTA value, it shows how much better or worse an animal is compared to that standard.
Dairy Base Cow (Milk Production & Fertility)
| Metric | Milk Yield | Fat Kg | Protein Kg | Fat % | Protein % | Calving Interval | Survival |
|---|---|---|---|---|---|---|---|
| Cow Base | 6,044 | 236.2 | 207.5 | 3.91% | 3.43% | 398.8 days | 85.3% |
- For example, if a cow has an EBI of €100, it means she is genetically better than the base cow, and her calves are expected to be €100 more profitable over their lifetime.
2024 Key Performance Indicators in Dairy Herds
| KPI Metric (2024) | Btm 20% | Average | Top 20% | Diff. |
|---|---|---|---|---|
| Average EBI | €117 | €177 | €234 | €57 |
| Herds | 2,606 | 13,879 | 2,606 | |
| Dairy Cows | 78 | 99 | 143 | |
| Milk Litres per Cow | 4,966 | 5,084 | 5,495 | 411 |
| Butterfat % | 4.14 | 4.31 | 4.51 | 0.20 |
| Protein % | 3.43 | 3.54 | 3.67 | 0.13 |
| Kgs Milk Solids / Cow | 387 | 411 | 462 | 51 |
| SCC | 206 | 184 | 142 | -43 |
| Milk Price (cpl) | 49.0 | 50.7 | 53.1 | 2.35 |
| 6-Week Calving Rate | 60 | 69 | 81 | 12 |
| Calving Interval (days) | 399 | 385 | 372 | -14 |
| AI Bred Repl. % | 38 | 59 | 91 | 32 |
| Kg CO2 / Kg FPCM | 1.08 | 1.02 | 0.93 | -0.09 |
How to increase EBI on your farm:
- Check your HerdPlus EBI report for the genetic indexes of your herd and identify the traits you wish to improve, focusing particularly on milk production and fertility.
- Select a team of bulls from the ICBF active bull list that are on average better that the genetic index for the traits you wish to improve: Click here to view ICBF Active Bull Lists
- Focus breeding replacement females from your heifers – breeding heifers to carefully selected high EBI bulls is one of the fastest ways to improve herd EBI and profitability.
- The Sire Advice tool can be used to allocate selected bulls to the cows in your herd.