
In line with international best practice, Ireland has now moved to applying a Test Day Model (TDM) approach for genetic evaluation of milk production traits, as opposed to the previous approach of predicted 305-day yield.
The name of this methodology comes from the fact that every test day record on each cow is used rather than the previous 305-day model, which used a standard lactation curve for each cow regardless of the number of milk recordings throughout the year.
In the previous 305-day model the yield changes using only the current recording each time. Also, the shape of the lactation curve was the same for each animal and did not account for more persistent milkers, i.e. cows with flatter curves that milked well at the back end of the lactation.
Figure 1: 305 day lactation curve
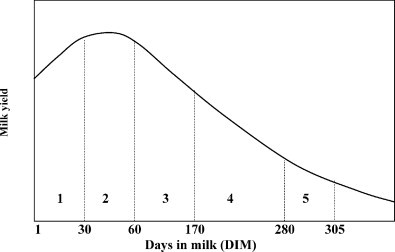
Figure 1 shows a standard 305-day lactation curve. With this model the curve was fixed for all animals of the same breed, age and lactation number. After each milk recording this curve moves up or down according to the yield and the days in milk and this predicted the 305 day yield.
Benefits of the new TDM
The TDM is better able to account for environmental factors on the day of the milk recording, such as weather, feed levels and grass quality.
It also allows animals to have different shapes of lactation curve as can be seen in Figure 2 below and it uses all available lactations, were before the 305-day model only used lactations 1 to 5.
Another benefit of the TDM is that at some point in the future, we will be able to generate breeding values for persistency. As a result, farmers will be able to select AI bulls knowing what level of persistency the daughters of those bulls will have.
The weightings of each lactation used in the evaluations are; 1st lactation 0.41, second lactation 0.33 and 3+ lactation 0.26. These weightings are based on the number of records in the evaluation.
Figure 2: Lactation Curves of bulls
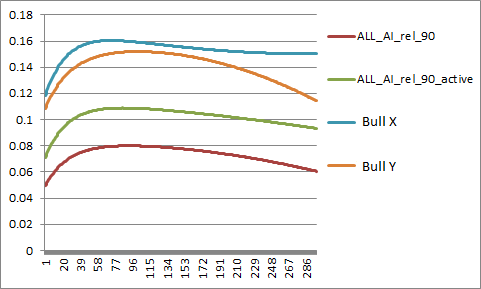
In Figure 2 above, the red line shows the average lactation curve of all bulls with EBI reliability greater than 90%. The green line shows the lactation of all the active bulls with reliability greater than 90%. The active bulls are much higher which is to be expected because these bulls have been selected for production.
The orange line shows the lactation curve of Bull Y and the blue line shows the lactation curve of Bull X. The graph clearly shows that Bull X peaks higher but also stays more persistent through to the end of the lactation whereas Bull Y does not peak as high and drops off more towards the end of the lactation. This information has never been captured before and will influence changes in EBI figures.
Summary
The TDM approach is scientifically proven to be more accurate, as it can account for non-genetic effects specific to each test day, (e.g., weather) as well as persistency. Given that it is more accurate, the average reliability for production traits for cows has increased. For example, cows with two or more lactations has increased by 8 percentage points (i.e. from 58% to 66%).
The change to the TDM has increased EBI values by approximately €10 – 15 in the December evaluation.