
The latest HerdPlus End of Season Fertility reports are now available for viewing online under the reports section. This report is an excellent tool for farmers to analyse their herd’s overall fertility performance in detail. The report is broken down into 7 sections:
- Section (a) outlines your herd’s Calving & Fertility summary for this Spring.
- Section (b) displays a graph of your Current Herd Submission Rate compared with the Teagasc Target (dashed line).
- Section (c) details Fertility Key Performance Indicators (KPI’s) comparing your herd with the national average on the 21- and 42-day submission rates, first service conception rate, 6-week and overall pregnancy rates for both cows and heifers.
- Section (d) highlights the number of short, normal and prolonged Repeat Intervals.
- Section (e) displays the Herd Fertility Performance broken down by lactation number.
- Section (f) provides a detailed breakdown of Top usage of Dairy Bulls in your herd in terms of number of serves and % in calf.
- Section (g) contains an Action List of Cows not yet submitted for service that have calved greater than 30 days. (Note: Cows not intended for breeding should be marked for culling in our ‘Mark for Culling’ screen, to ensure that they do not affect your herd’s submission rate or appear in your herd’s ‘Action List’.)
Click here to view an example report
National Averages 2020 vs 2021:
The national average 21-day submission rate for cows remains the same as 2020 at 71% but sees an increase from 78% to 80% for heifers. Similarly, the 42-day submission rate for cows remains the same as 2020 at 86% while there is a slight increase from 85% to 86% for heifers.
The first service conception rate has disimproved slightly for both cows and heifers, seeing a reduction from 60% to 58% for cows and 76% to 75% for heifers.
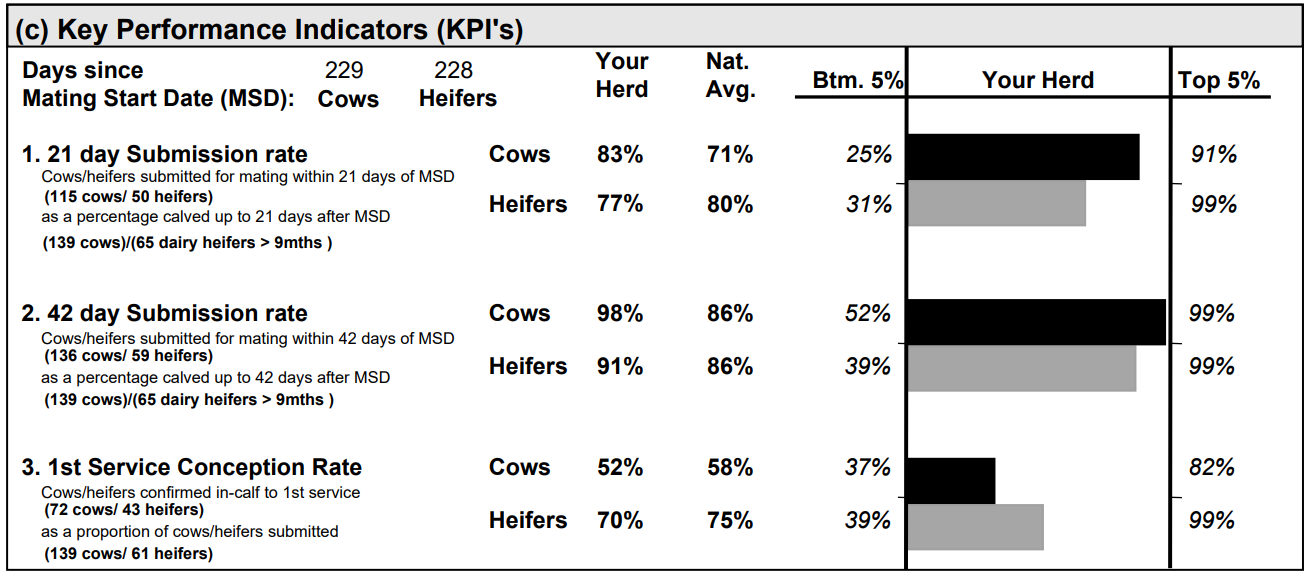 Figure 1: Displays Key Performance Indicators (KPI’s) 1, 2 and 3, 21-day Submission rate, 42-day Submission Rate and 1st Service Conception Rate. Herd specific data for cows and heifers (Spring 2021) is outlined alongside the National Average(Spring 2021) for each KPI, to allow farmers to compare their performance. The top and bottom 5% are also displayed. Data was extracted from 2,400 dairy herds to calculate the national average for 2021.
The 6-week pregnancy rate has also seen a reduction of 2% for cows and 1% for heifers sitting at 69% and 88% respectively. The overall pregnancy rate remains unchanged at 91% for cows and 97% for heifers.
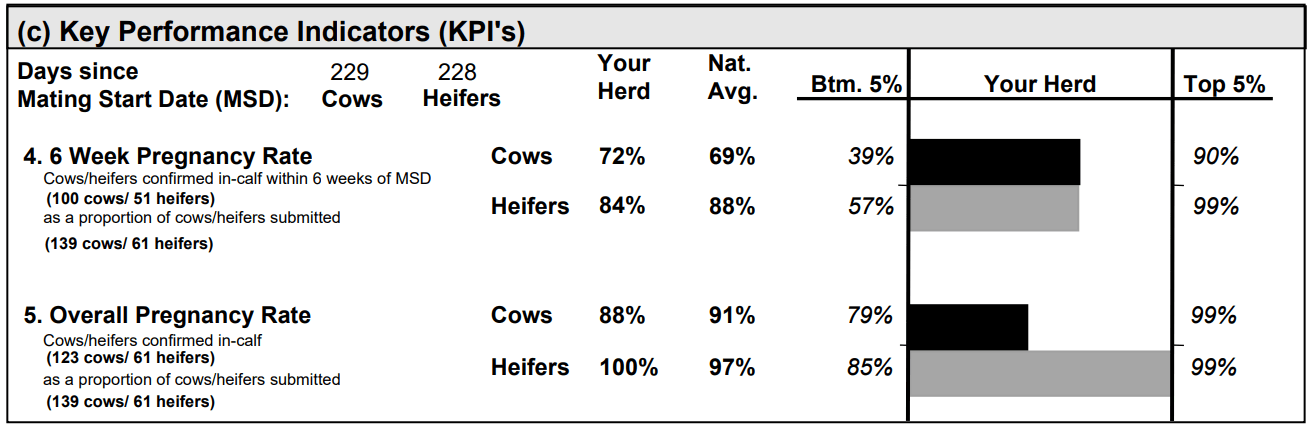 Figure 2: Displays Key Performance Indicators (KPI’s) 4 and 5, 6-Week Pregnancy Rate and Overall Pregnancy Rate. Herd specific data for cows and heifers (Spring 2021) is outlined alongside the National Average(Spring 2021) for each KPI, to allow farmers to compare their performance. The top and bottom 5% are also displayed. Data was extracted from 2,400 dairy herds to calculate the national average for 2021.
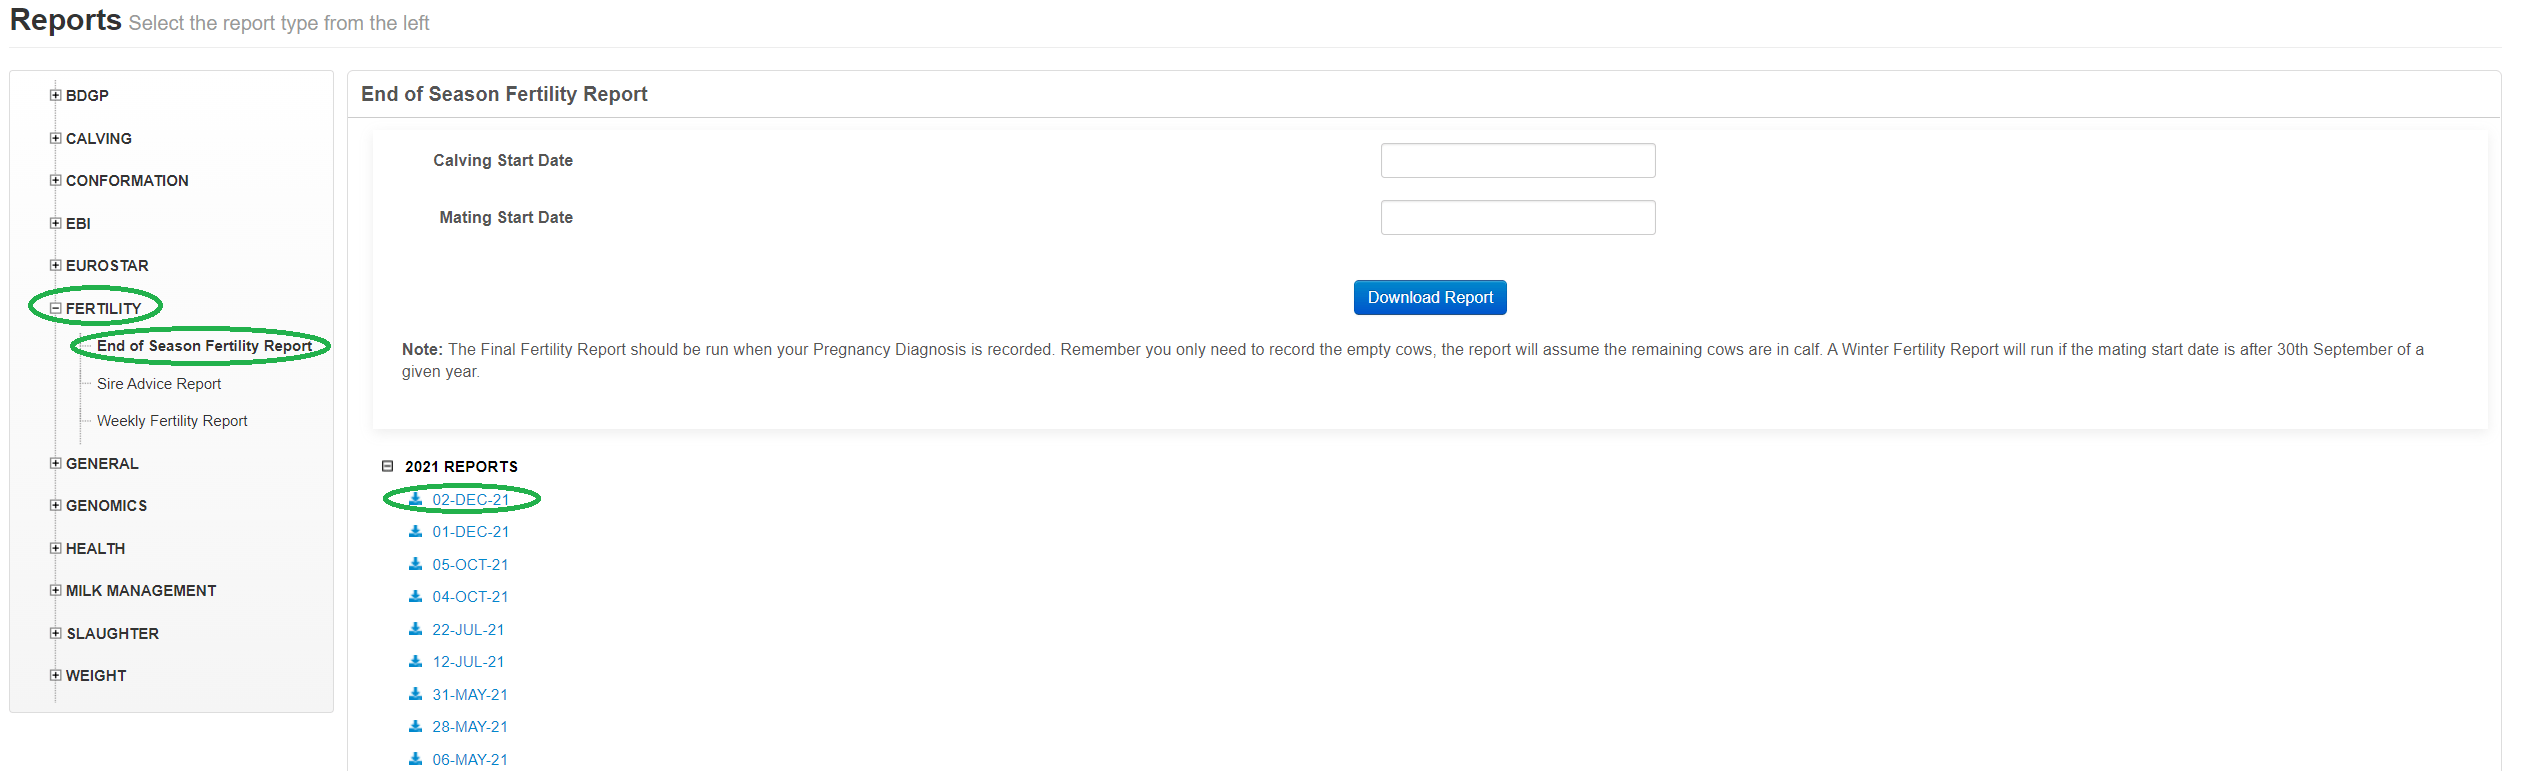
How to access the End of Season Fertility Report?
- Log-in to your HerdPlus account and go to ‘Reports’ –> ‘All Reports’.
- Select ‘Fertility’ followed by ‘End of Season Fertility Report’.
- Your latest report should appear in the list.
- You can rerun your End of Season Fertility Report at any stage by entering in your herd’s calving and mating start dates and clicking ‘Download Report”.
If you have any queries about your End of Season Fertility report, please contact the HerdPlus office on 023-8820452 or email [email protected]