
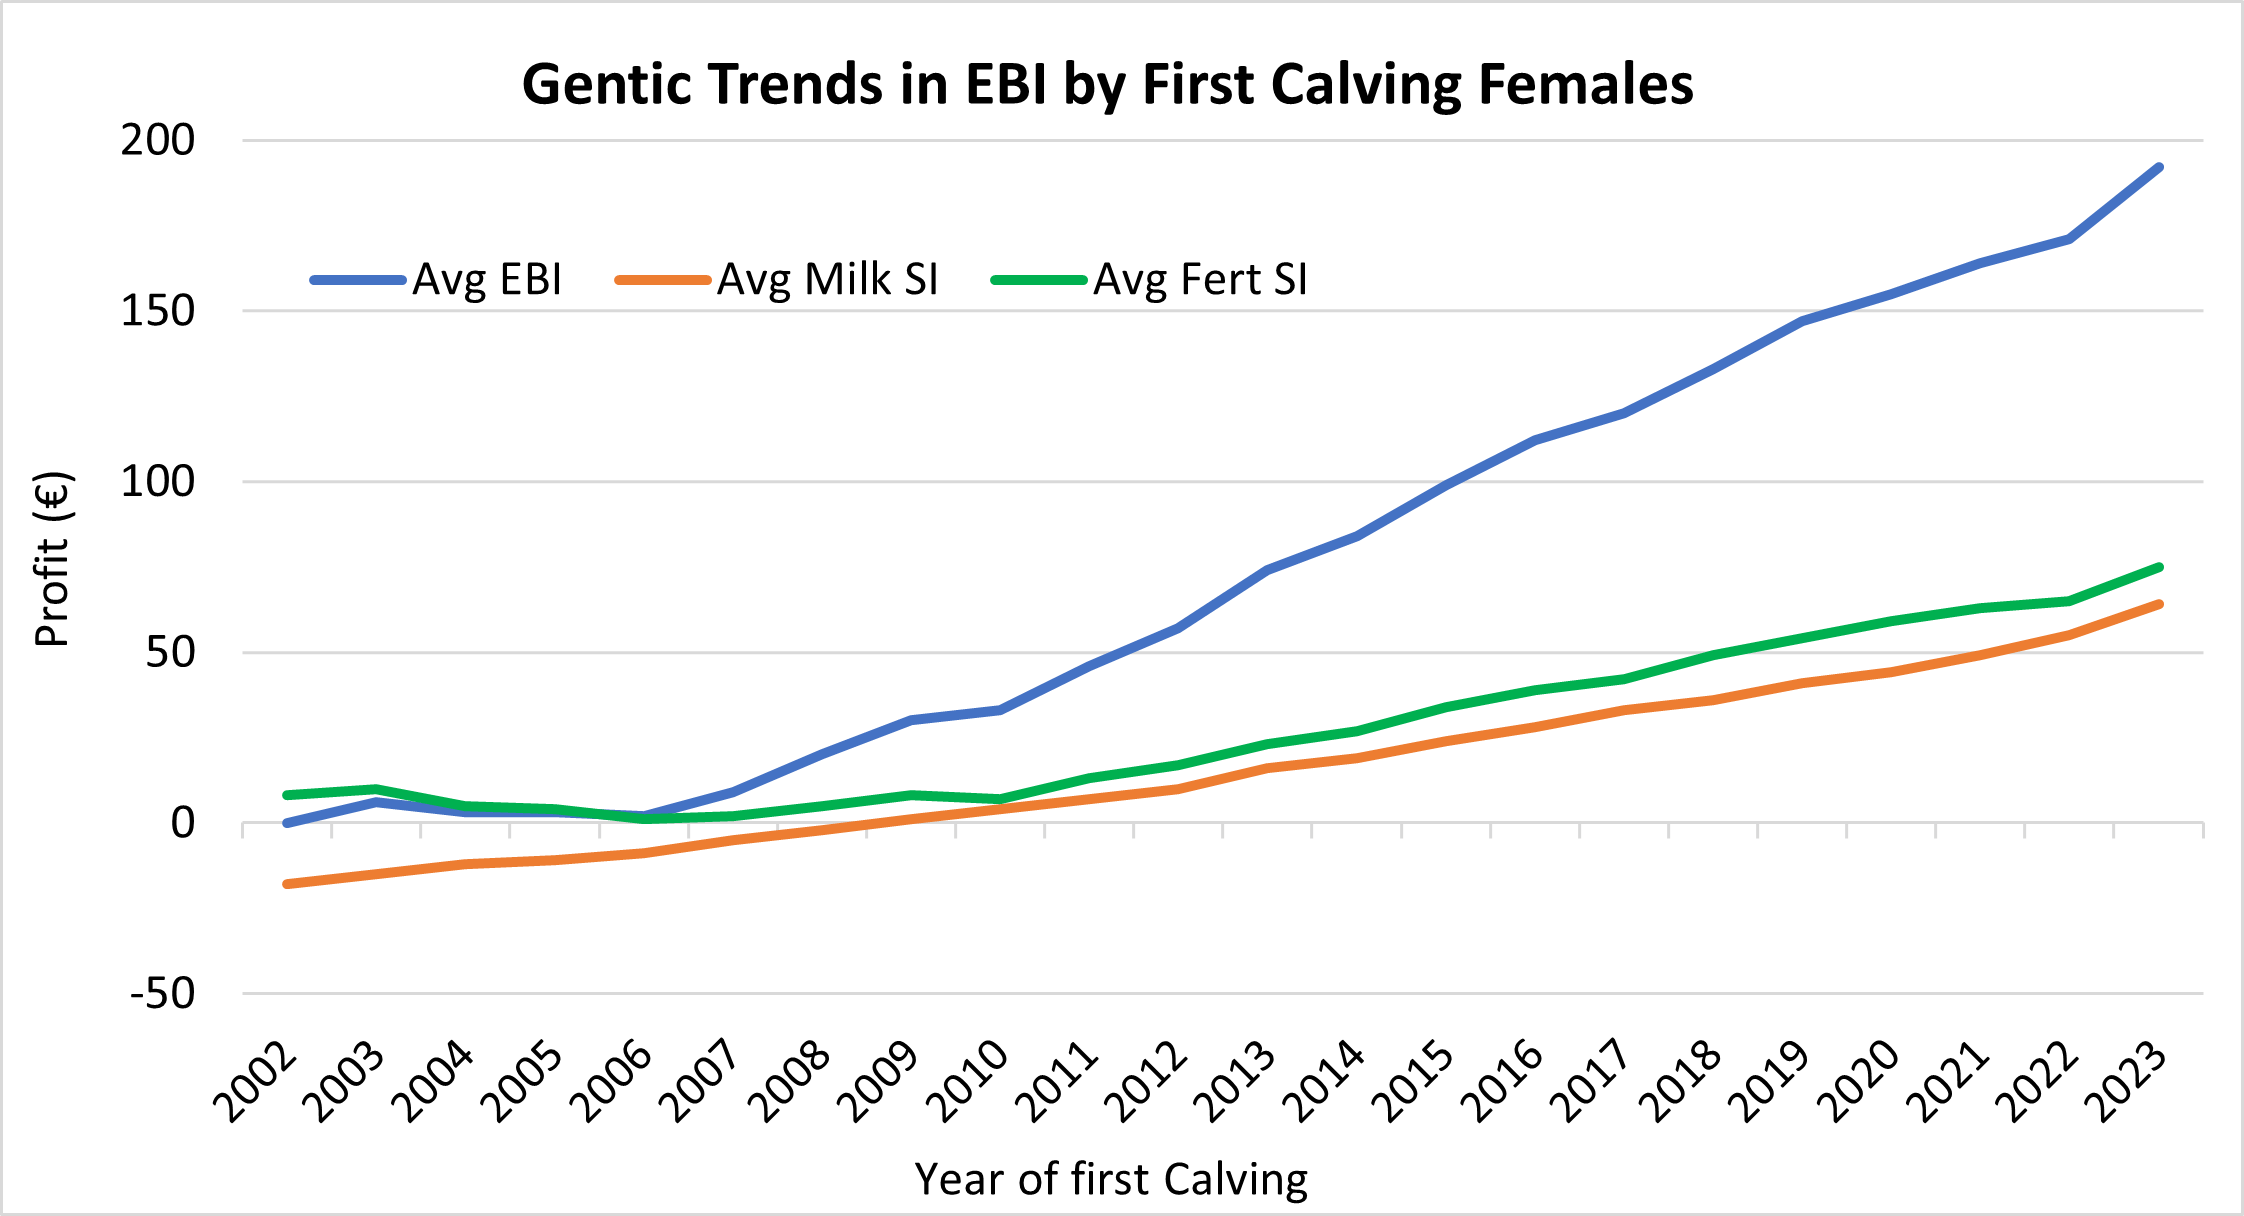
The Economic breeding Index (EBI) is a tool used to assess the genetic merit of animals and to identify the most profitable animals in the herd. It was developed by the Irish Cattle Breeding Federation (ICBF) along with Teagasc and it has been in existence for over 20 years now. EBI is now widely used by Irish dairy farmers to select the profitable sires for their dairy herds. The rate of genetic improvement by year of first calving heifers is shown below in graph 1. The EBI has increased on average by €10 per annum over the past 10 years with no sign of slowing down. The rate of genetic progress for the milk sub-index and the fertility-sub index are very similar indicating a balanced genetic gain. Research from Teagasc has shown that for every €1 increase in EBI will generate €2 extra profit per cow per lactation. For example, for a 100-cow herd size, this equates to €2000 more profit through making better breeding decisions. Genetic gain from good breeding decisions is cumulative and permanent and the graph below highlights that Irish farmers are breeding in the right direction.
Improvements to the Economic Breeding Index
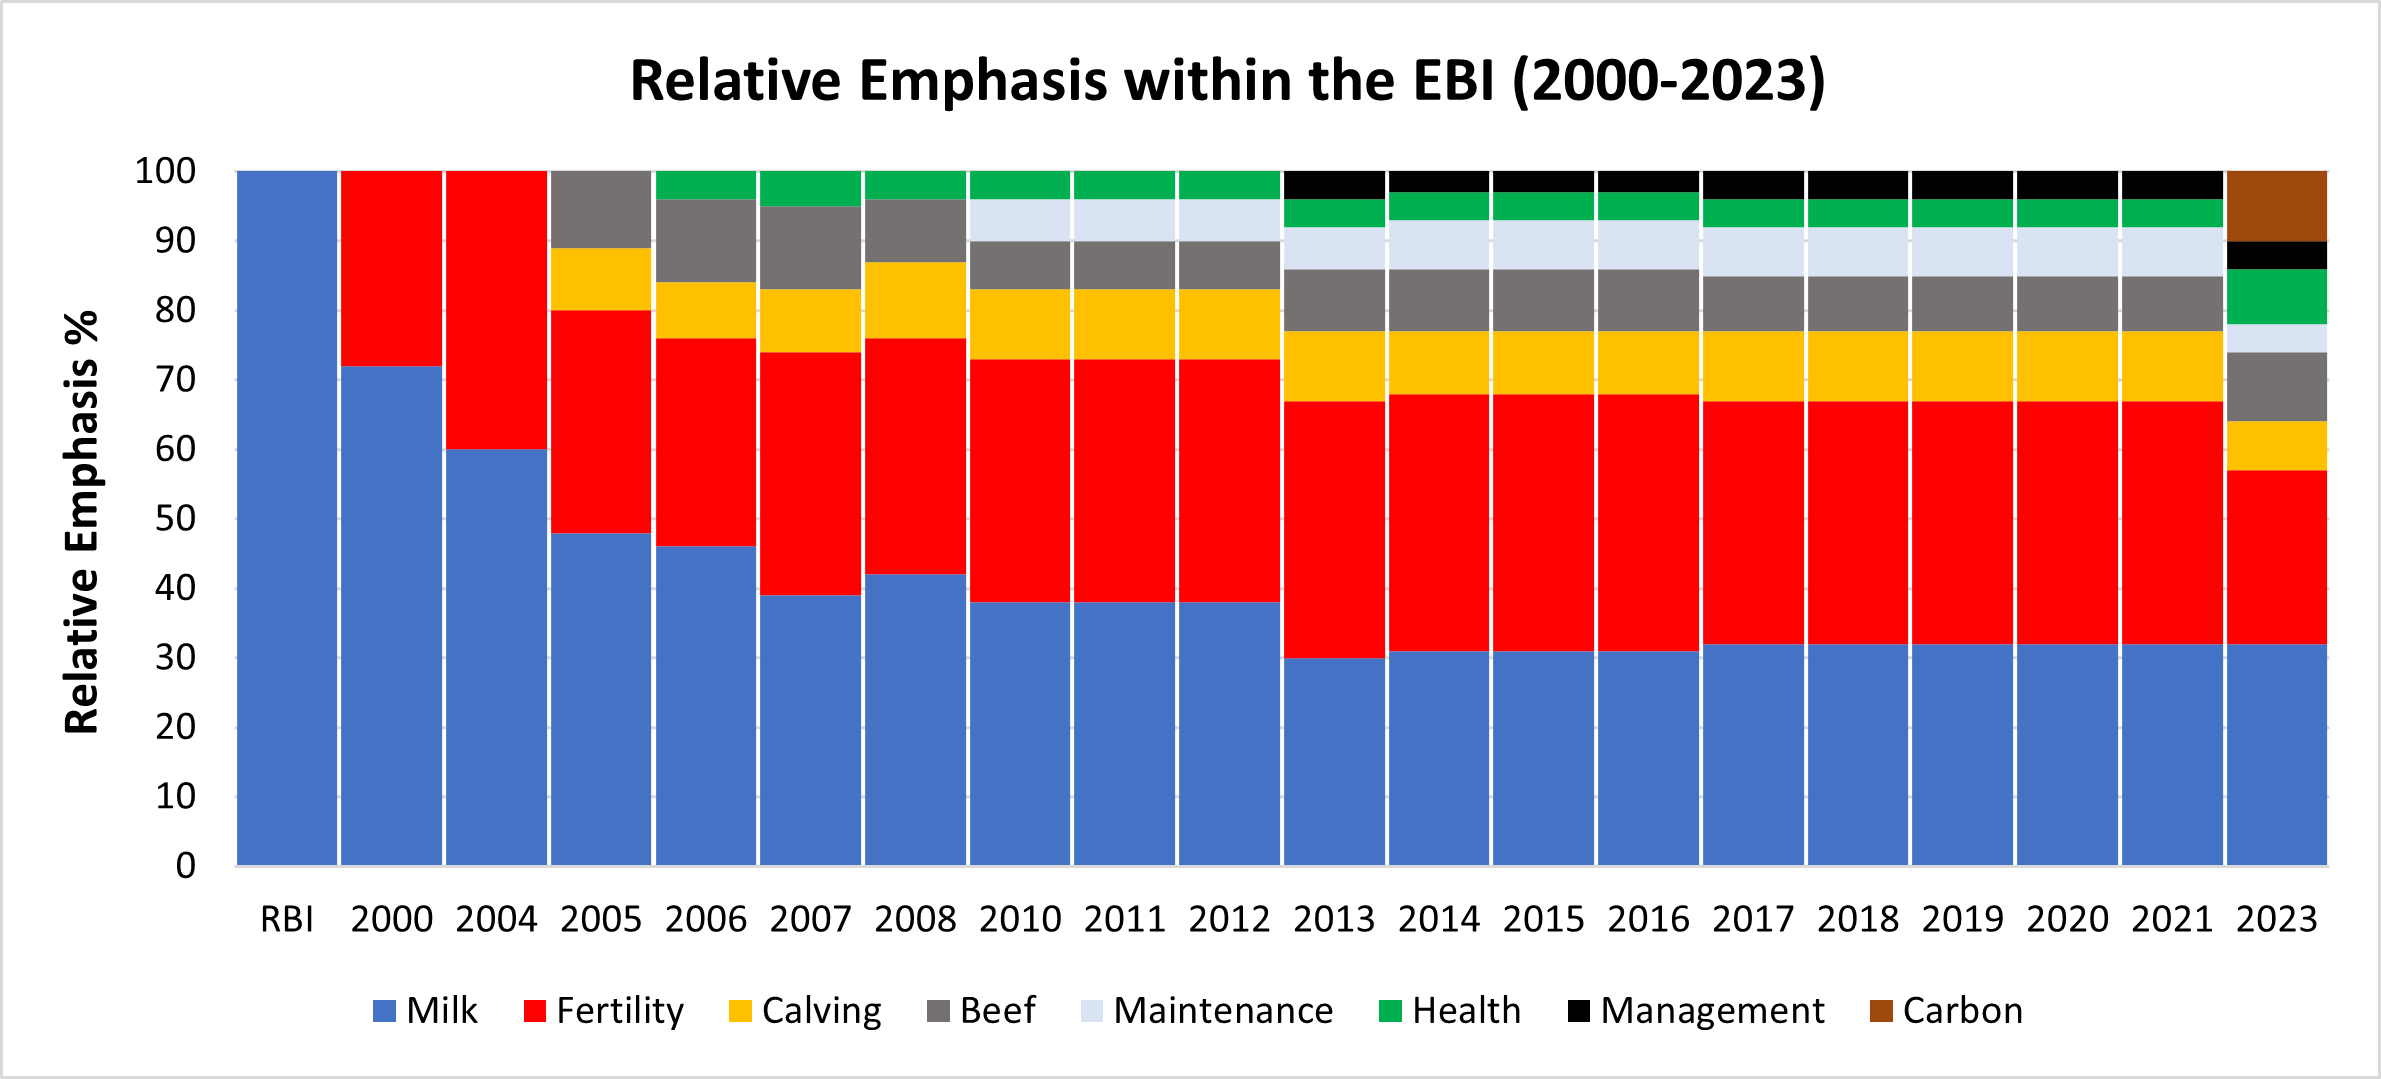
The evolution of the EBI since it was established 20 years ago is presented in graph 2 below. Prior to the launch of EBI, the Relative Breeding Index (RBI) was the breeding index used by Irish farmers which focused on genetic improvement for milk production only. However, while the national milk performance was improving, the fertility performance of the national herd was declining due to the negative correlation between high production and fertility. Grass based systems in Ireland are seasonal and highly dependent on good fertility in dairy cows to achieve lower empty rates, calve more compactly and for cows to survive longer. The introduction of the EBI helped to improve the declining fertility performance in the national herd with the addition of a fertility sub-index in 2001, which is currently measured by calving interval and survival traits.
The Economic Breeding Index has continued to develop ever since with the addition of new data, new traits, changes to the economic values of traits, and better prediction methods. New traits that are economically, socially, and environmentally importance have been incorporated into the EBI since its inception. The calving and beef sub-index were introduced in 2005, the health sub index was introduced in 2006, the maintenance and management were introduced in 2010 and 2013 respectively. Some of the most recent updates to the EBI include the addition of TB breeding values to the health sub-index, breeding animals that are more resistance to Tuberculosis (TB) and the introduction of the carbon sub-index in 2022 to help Irish dairy farmers breed a more environmentally efficient animal even faster though breeding. The objective of on-going changes to the EBI and updating the relative emphasis will ultimately help farmers breed the most profitable cows for the future. Future improvements to the EBI are likely to include the development of a new fertility sub-index (where research is on-going on new methods to better evaluate female fertility) and the addition of more traits to the health sub-index. Both these improvements in the current traits will improve the accuracy of the genetic evaluations and accelerate genetic gain.
The Impact of herd EBI on Key Performance Indicators
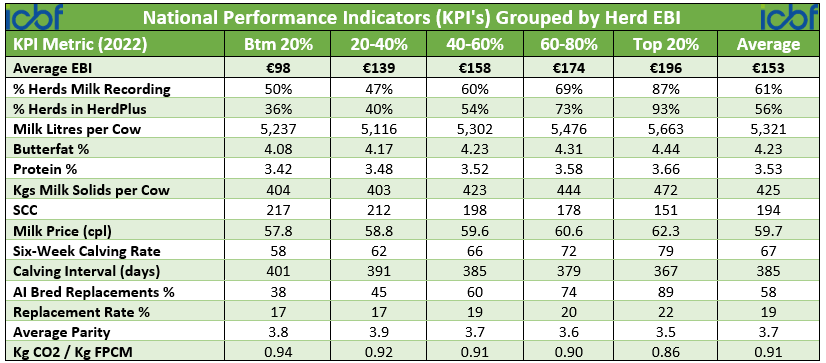
How does the latest genetic trends translate to the performance on the ground? Recent analysis carried out by ICBF and Bord Bia on 14,142 manufacturing milk herds has shown that higher EBI herds are more profitable and produce less GHG emissions compared to the lower EBI herds. (This is presented in table
1). The key performance indicators in table 1 were sourced from EBI reports, Co-op performance reports, Dairy calving reports and Bord Bia Data. These Key performance indicators (KPI’s) contribute to greater profitability and sustainability on dairy farms and can be used to track herd performance and identify areas for improvements. The table clearly shows how varying levels of herd EBI impacts farm performance but also the carbon footprint of the national dairy herd. The higher EBI herds produced 0.08 kg lower milk carbon emissions than herd in the bottom 20% per year. The top 20% and the average EBI herds have an EBI of €196 and €153 respectively.
When comparing for the milk performance of the Top 20% of herds on EBI to the average EBI herd, the top 20% had 342 higher litres per cow, 47kg better milk solid per cow and 43k lower somatic cell count. For the fertility performance, the top 20% of herds had 12% better six-week calving rate, 18 days shorter calving interval and a 31% higher percentage of AI bred replacements compared to the average herd EBI.
The higher EBI herds also produced less GHG emissions compared to the lower EBI herds. There is also higher percentage of herds engaged in milking recording and signed up to HerdPlus (ICBF subscription service) compared to average EBI herd. From a financial perspective, the differences between the top and the average herd EBI for milk equates to around €350/cow. This is the equivalent of around €35,000 in a typical 100-cow herd.
Sustainable Breeding
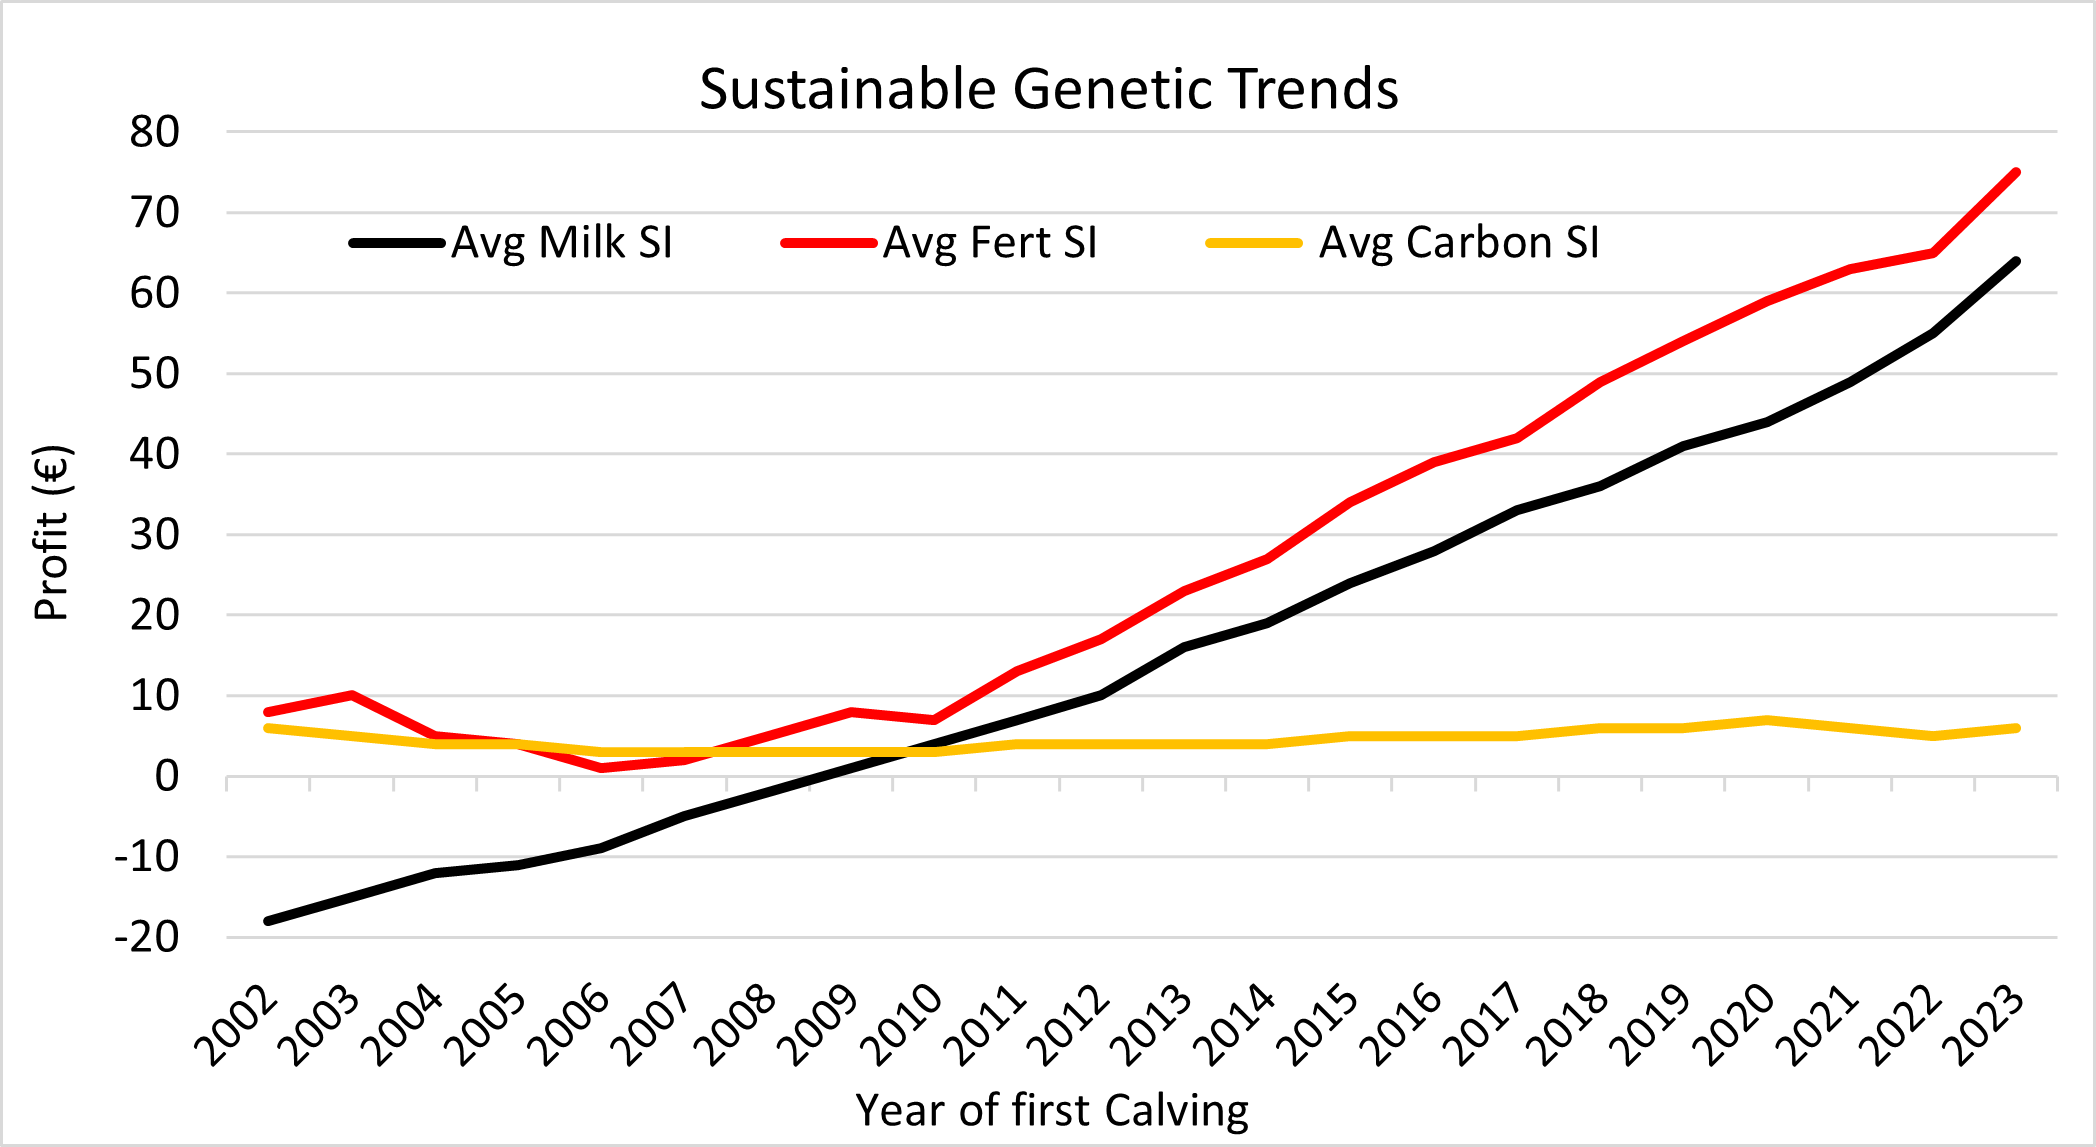
When EBI was launched, the carbon sub-index values were declining due to increased milk production, cows were eating more and emitting more methane, but fertility was not improving. This can be seen clearly in graph 3. However, in recent years the carbon sub-index has started to improve while milk also has continued to improve. This is due to the increased fertility performance of the national herd with cows surviving longer and calving earlier, therefore maximising the amount of grazed grass in their diets. This is an extremely encouraging trend while at the same time increasing milk production. The EBI is breeding for a more carbon efficient animal.
Summary
The evidence is very clear that EBI delivers more profitable animals for grass-based systems while also minimising GHG Emissions. Over the last 20 years the average EBI for the national herd has increased by €150, which makes the national herd on average €300/cow/year more profitable than 20 years ago. EBI will continue to evolve and contribute towards improved profitability and sustainability of the national dairy herd into the future.