
The 2023 end of year Co-op Performance Reports containing the latest co-op data are now available online and are being posted to farmers over the coming week. These reports include the calving information taken from the 2023 Dairy Calving Report.
The report combines milk supply data from the various Co-ops with the herd data from the ICBF database including information such as cow numbers, calving dates and EBI information.
The Co-op performance report is designed to highlight an individual herd’s performance at different stages throughout the year. Farmers can benchmark their herd’s performance against the average and top 10% within their Co-op. Herds are ranked accordingly to indicate their position.
Please note: Herds are compared with other herds of the same milk type i.e. Creamery, Liquid and Winter.
The Co-op performance report gives an excellent overview for farmers of their production and fertility performance along with the genetic merit of their herd. It also allows them to compare their performance and benchmark their performance against other herds across numerous key performance indicators (KPI’s).
The Co-op performance report is highly sought after by financial institutions when farmers are applying for loans. Generally, financial institutions will request the Co-op performance report for the previous 3 years. (Historic reports can be accessed at any stage online at www.icbf.com)
The report is broken down into 3 main areas for analysis of on-farm performance.
- Milk Production
- Herd Fertility
- Herd Genetic
Milk Performance
Litres per cow/day
This is the average litres of milk supplied on a per cow basis. To calculate this figure, we use the following method:
Total litres/number of days/sub-total of total cows = litres per cow per day.
These figures can help farmers evaluate their herds performance compared to other herds and identify areas for improvement in their milk production.
To ensure the accuracy of the ‘Total Cow’ figure, farmers should record dry offs and where applicable mark for culling. This will more closely reflect what the supplier is seeing in the parlour.
Fat & protein %
To calculate the fat and protein %, a weighted average is used. In an A+B-C payment system fat and protein are both crucial to maximising the milk price farmers received.
Fat + protein (kg/cow)
The following method is used to calculate the fat and protein kg per cow:
- Total litres of milk x 1.03 (this converts litres to kilograms)
- Total kgs x fat % = kgs of fat
- Total kgs x protein % =kgs of protein
- Total kgs fat + total kgs protein/ total cows = total fat & protein kg per cow
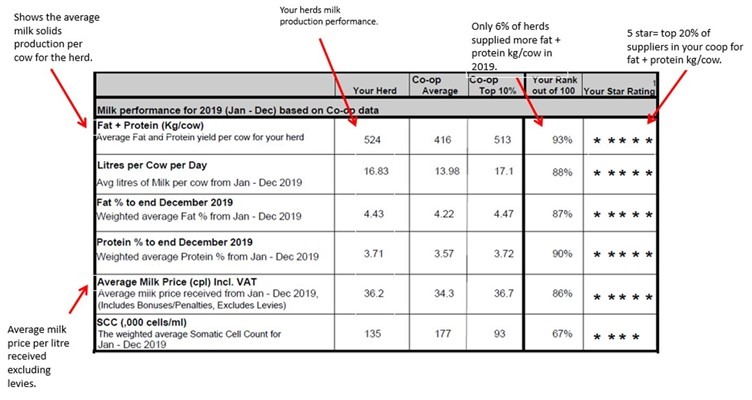
Delivering as many milk solids as possible per cow is a key driver of profitability in spring calving grass-based systems.
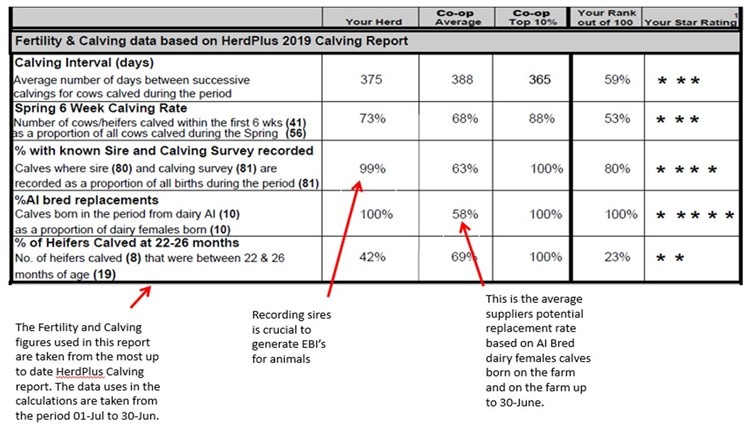
Herd Fertility
Calving interval (days)
This is the average number of days between successive calvings. The national target is to achieve a 365- day calving interval so cows calve on the same day every year to maximise reproductive efficiency.
Spring 6-week calving rate
This relates to the number of cows who calve in the first 6 weeks as a proportion of all cows that calve in the spring. It has been recommended in Ireland that farmers should target a 90% 6- week calving rate as this syncs the calving spread to the grass growth curve with the aim of maximise the amount of milk produced off grass.
% AI Bred Replacements
This is the number of female calves born from dairy AI as a percentage of all cows calved.
% of Heifers calved at 22-26 Months
This is the percentage of heifers that calved between 22-26 months of age as a proportion of all the heifers. Research has clearly shown that heifers that have calved at this age are more profitable in their lifetime then animals that calve for the first time at older ages. For more information on this, check out recent research conducted in 2019. https://www.icbf.com/?p=14740
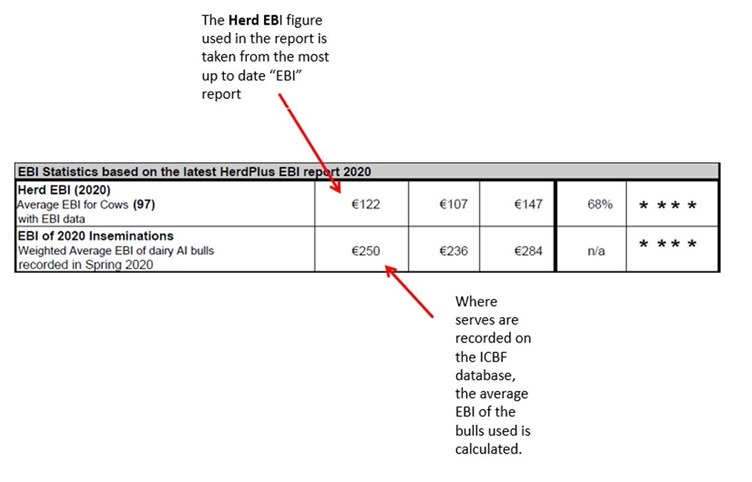
Herd Genetics
EBI Statistics
The EBI of the herd represents the profitability of the herd above the base. By increasing the EBI of the herd it will in turn help drive profitability. Teagasc research has shown that, on average, a 1 euro increase in EBI will result in a 2 euro increase in profit.
EBI Inseminations
This is the average EBI of the team of bulls used by the farmer. Farmers should aim to use a team of bulls with a higher EBI than the herd. Using a team of High EBI bulls will drive genetic gain within the herd. This can be maximised by selecting young high EBI genomic sires, it is important to select a team of bulls as this will spread the risk.
To ensure the accuracy of the ‘Total Cow’ calculations, please ensure to record a dry off date and mark for culling where an animal is being fattened. This will include their milking information up to the point of drying off. This information can be recorded on-line at www.icbf.com.
Milk production and reproductive efficiency are crucial to profitability and the co-op performance report can be used to help farmers assess how they are performing as well as highlighting areas for improvement.
Please call the HerdPlus office on 023 8820452 with any queries or email [email protected]