
Why Milk Record – Donagh Berry1 and Matthew Thompson2

Summary
- Milking recording key benefits which can be broadly categorised as:
- Enhanced precision management and breeding of individual animals
- Optimising herd-level management
- Supporting national genetic progress in the dairy herd
Introduction
The benefits of individual cow milk recording, over and above herd level bulk tank analysis, can be summarised as:
- Identifying individuals excelling or lagging in solids yield or composition
- In combination with live-weight data, being able to identify (in) efficient cows
- Delivering more accurate genetic evaluations and breeding indexes: a) useful for selecting dams as parents of the next generation. b) data contributes to more accurate national genetic evaluations of bulls
- Greater precision in estimating feed requirements per cow
- Identifying animals that could be stressed within a herd despite a normal milk bulk tank reading
- Useful to detect underlying animals with potential issues (e.g., somatic cell count [SCC]) prior to realisation in the bulk tank
- Provide individual animal yields which are more and more required by lending institutions to estimate repayment ability
- Can command a higher price when selling (surplus) stock
- Add value to individual animals in the case of herd (partial) depopulation
- A vehicle for pregnancy diagnoses in early lactation
- A vehicle to deliver predictions of some health ailments (e.g., ketosis) from infra-red spectral data of the milk samples
- Biological material for health screening (e.g., IBR, Johnes)
- Act as an eligibility criteria for the selection of dams of future AI sires
- Required to obtain a Cow’s Own Worth (COW) index
- Useful at the end of lactation for deciding selective dry cow therapy
- Improved accuracy of genocells to predict individual cow SCC by being able to predict relative yield per cow
Opening your eyes to within-herd variability in cow performance
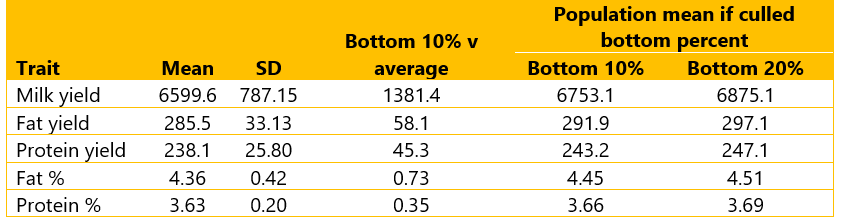
Large variability within herds in yield and milk composition exists among cows, even among those of the same parity. Table 1 provides the mean and variability of 305-day milk yield and milk composition within herd contemporaries for Irish milk recorded herds; all herds had >70 cows milking. The mean values are mature equivalents while inter-parity differences in mean yield have been accounted for when estimating the variability. Clearly large variability in performance exists among cows within a herd – this can only be captured through milk recording. For example, the bottom 10% of the herd on milk yield are expected to yield 1,381.4 kg less milk than the average cow (of the same parity) in that herd which represents a difference of 21%. This can be doubled when comparing the bottom 10% of yielding cows to the top 10% of yielding cows. Therefore there is >40% difference in yield between the top 10% and bottom 10% of yielders in a herd with the same statistic being true for fat and protein yield. A large difference also exists for fat and protein concentration in the milk with the mean fat and protein percent in the milk of the worst 10% of cows being 0.73 and 0.35 percentage units, respectively lower than the mean of the herd.
Table 1 also demonstrates the expected change in the mean yield and composition of the herd if the bottom 10% or bottom 20% of cows for that trait were culled. Doing nothing other than culling the bottom 20% of cows on fat percent is expected to increase the mean fat percentage of the herd from 4.36% to 4.45% – the respective impact for protein percent is an increase from 3.63% percent to 3.66%. Only regular milk recording can detect these poor performing animals – the potential return from identifying these animals alone far outweighs the cost and inconvenience of milk recording.
Efficiency of production is growing in interest. No single metric can fully capture efficiency. However, milk solids per kg live-weight is often used as a proxy for efficiency. Obviously both individual cow milk solids and live-weight data are required. From an analysis of 12,413 lactations from 11,062 Irish cows in 85 different herds, the mean and standard deviation 305-day milk solids per kg live-weight was 0.96 and 0.13, respectively. This means that the mean of the top 10% of animals on milk solids per kg live-weight is 1.18 while the mean of the bottom 10% is 0.73. Considerable improvement in efficiency therefore is possible through identifying these divergent animals and culling and breeding as appropriate.
Monitoring individual cow SCC is obviously also important, even if bulk tank SCC is okay. At any given time, approximately 19% of cows in 20% of Irish dairy herds have a SCC >200,000 cells/mL, while 11% of cows in these herds exceed 300,000 cells/mL. Not only is this of concern for these cows themselves, but it also puts the other cows in the herd at risk. Based on Irish population parameters and assuming all cows yielded the same, if the percentage of cows in a herd with a SCC >300,000 cells/mL increased from 11% to 20%, then the mean herd SCC would increase by 85,000 cells/mL.
Conclusions
Despite regular access to bulk tank yields and milk composition, averages can hide the underlying variability. Massive variability exists among cows within a herd and this variability can only be captured through individual cow milk recording. Milk recording, therefore, should not be viewed as a cost but as an investment.