
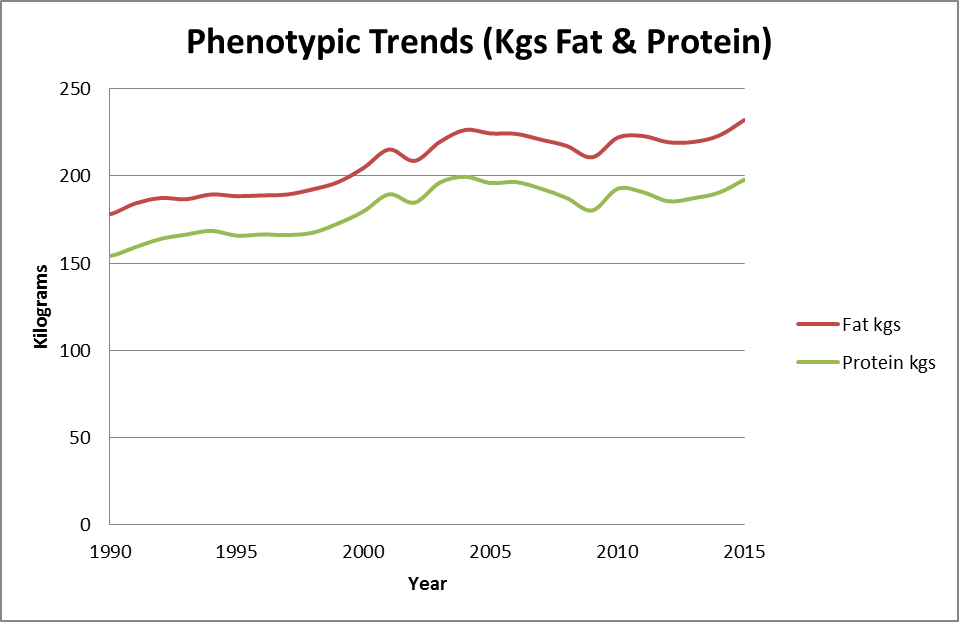
The latest stats on Phenotypic (cow’s actual performance) Trends for Fat and Protein have now been released. These figures show the trends for kgs of fat and protein and percentage fat and protein.
The most visible pattern that can be seen from these results is that there has been a consistent increase in both Fat and Protein kilograms and Fat and Protein %. The average figure for kgs fat in 1990 was 178kgs. This had increased by 54kgs by 2015 where the average figure was 232kgs. The average figure for kgs protein in 1990 was 154kgs. This had increased by 44kgs by 2015 where the average figure was 198kgs.
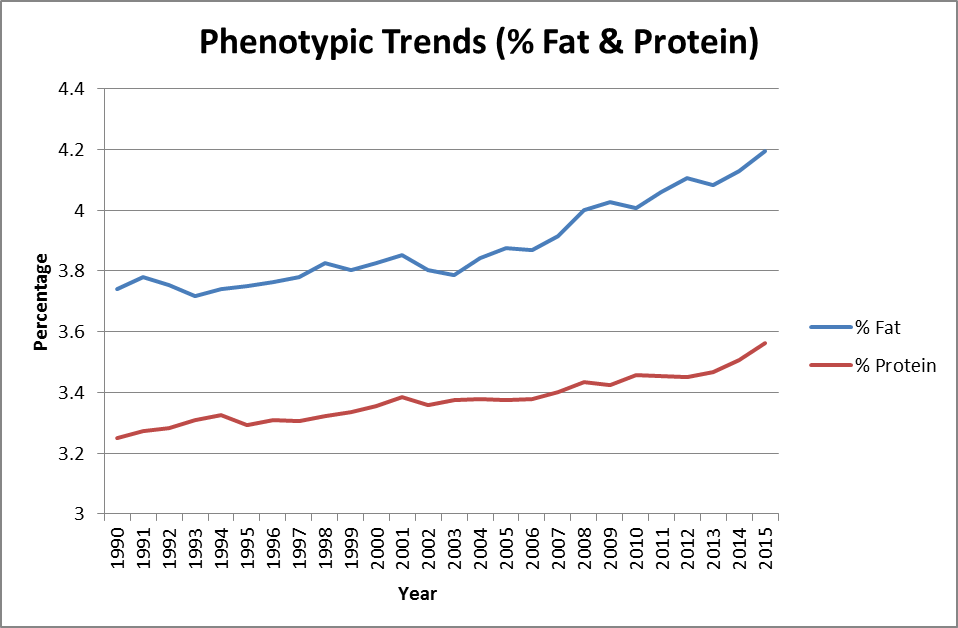
The average figure for % fat in 1990 was 3.74%. This had increased by 0.45% by 2015 where the average figure was 4.19%. The average figure for % protein in 1990 was 3.25%. This had increased by 0.31% by 2015 where the average figure was 3.56%.
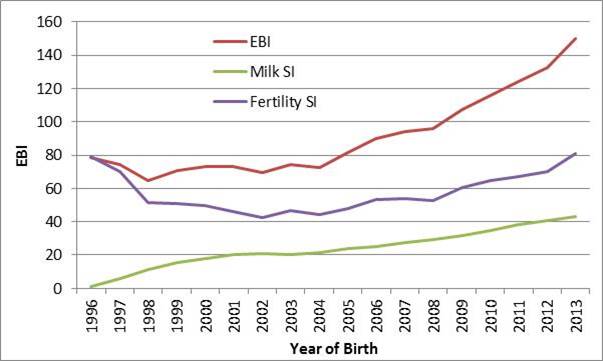
Now lets look at the genetic data in the table below. Coupled with an increase in milk solids, there has also been a consistent increase in both EBI, Milk and Fertility Sub indices. So while fertility is currently on the rise, this has not prevented us from continuing to make progress in production as can be seen above.
More statistics can be found on the ICBF Statistics page.