
The latest calving reports are now available online for all Dairy HerdPlus members. The report looks at all dairy calvings in the herd between July 1st 2024 and 30th June 2025. The report allows herds to evaluate their calving performance through Key Performance Indicators such as Calving Interval, 6 week calving rates etc. These Key performance indicators (KPI’s) contribute to greater profitability and sustainability on dairy farms and can be used to track herd performance and identify areas for improvements. Following the publication of the reports, the data indicates a positive trend in the fertility performance of the national Herd. The National Statistics are based on data from over 13,500 herds with 30 or more dairy cows.
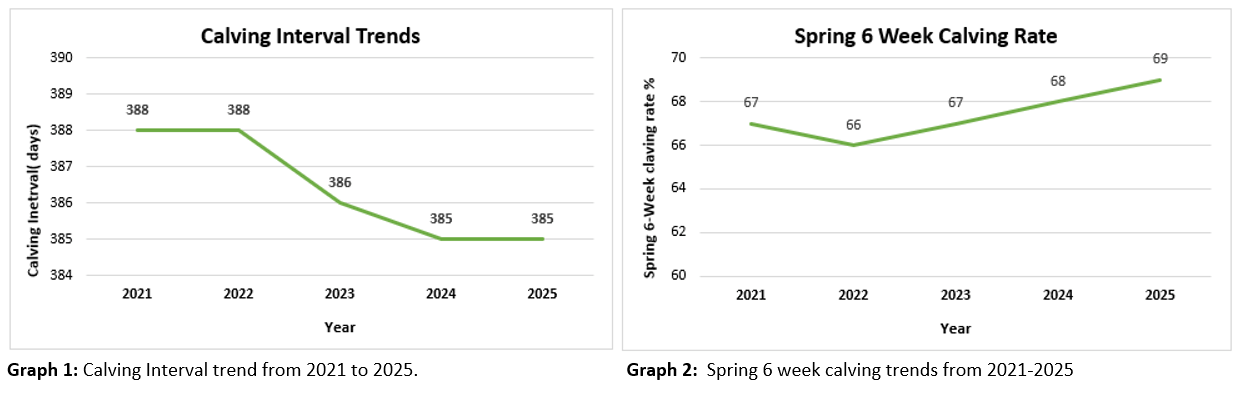
The calving interval, which is the length of time between two successful calving, remained consistent over the past few years. From 2021 to 2022 it remained stable at 388 days. However, the calving interval decreased to 386 days in 2023, followed by a further reduction to 385 days in 2024 and 2025, resulting in an improvement of 3 days over the past 5 years. This trend shows a gradual improvement in herd fertility and reproductive efficiency. This is shown in graph 1.
The spring six week calving rate, which is the number of heifers/cows that calves during the first 6 weeks is presented in graph 2. In 2021, it was 67%. A slight decline occurred in 2022, but the rate then showed a steady upward trend to 69% this year. The trends shows dairy cows are calving earlier in the Spring, which leads to increased milk production.
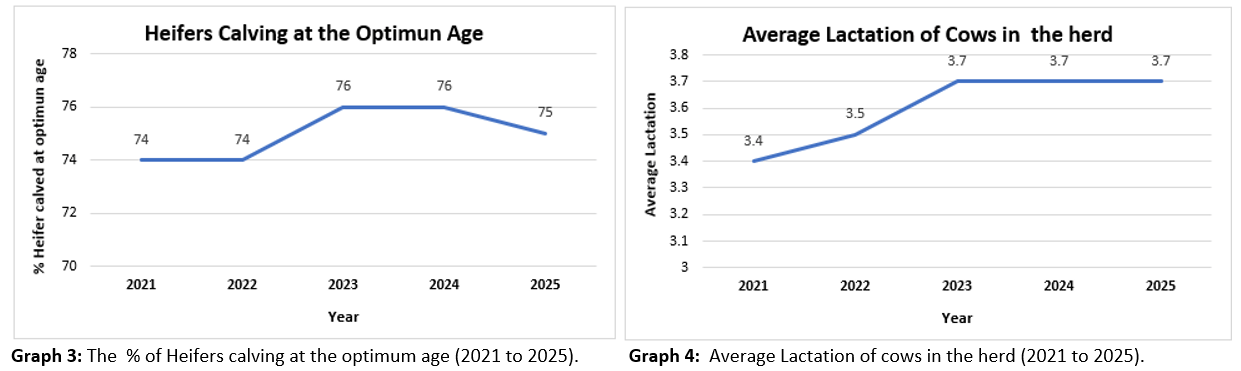
The percentage of heifers calving between 22 and 26 months of age is displayed in graph 3. Calving at the optimum age is crucial for increasing a heifer’s lifetime productivity, reduces rearing costs, and improves overall herd efficiency. In 2021, 74% of heifers calved within the optimal age range. This figure increased to 76% by 2023 and then remained stable through to 2024. However, it declined to 75% this year. Environmental factors, such as severe weather last spring, have also contributed to this decline. The average lactation for cows in the herd is shown in graph 4. In 2021, the average lactation was 3.4 and this figure increased steadily over the next three years to 3.7 by 2023. From 2023 to 2025, it remained stable at 3.7.This upward trend indicates cows are remaining productive (lower empty rates) and lasting longer in herds leading to increased profitability.
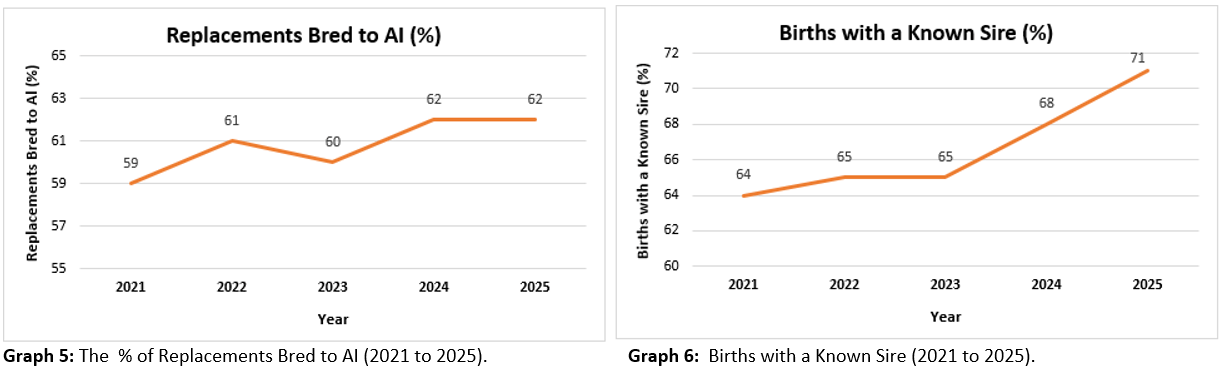
The percentage of replacement Bred to Dairy AI has steadily increased from 59% in 2021 to 62% in 2025. This can be seen graph 5. This upward trend shows an increasing emphasis on genetic improvement, as AI sires are considerably greater than the genetic merit of the average stock bull. Similar, the percentage of births with a known sire has also increased from 64% in 2021 to 71% in 2025. This is displayed in graph 6. Being able to identify the sire of an animal is vitally important from a genetic evaluation point of view. A sire is the most important piece of data that can be recorded on any animal.
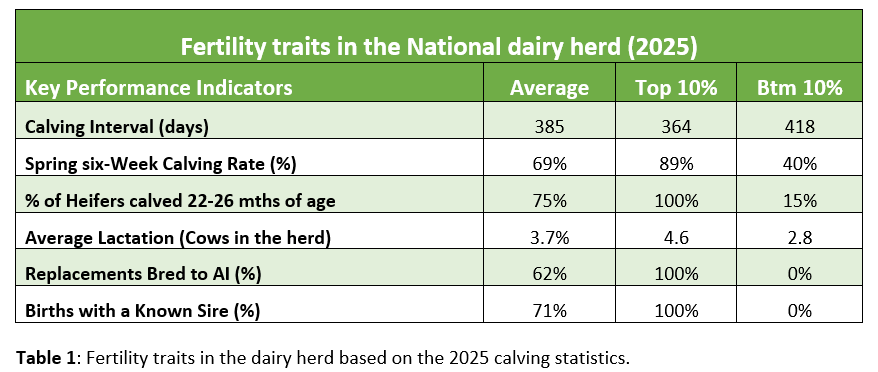
The summary of the fertility performance for the average, the top 10% and bottom 10% is shown in table 1 below. This is based on data from the latest HerdPlus Dairy Calving reports. The trends indicate large variation between herds that are achieving exceptional fertility performance (Top 10%) for each of the Key Performance Indicators (KPI’s), to those that are achieving below average performance (Bottom 10%). One trait of particular note is the percentage of heifers calved between 22 and 26 months of age. The average performance for this KPI is at 75%, with a number of herds achieving 100% (top 10%), but a similar number achieving only 15% in the (bottom 10%).
Summary
The calving statistics represent the most accurate and reliable measure of herd fertility performance, offering valuable insights for farmers. The latest data highlights positive trends in dairy cows performance on Irish farms. However, we are still a considerable behind targets identified by Teagasc as being required to ensure a profitable dairy industry. Therefore, it’s important that we continue to focus on high EBI bulls with a high fertility sub-index in order to achieve these targets.
Check out your herds latest calving reports to get an in depth assessment of the calving performance in your herd. This report is available in the report section of your HerdPlus account. View the summary of calving records by month and calving survey data. Benchmark your herd against the National average and Top 10% for the key performance Indicators such as Calving interval, six week calving rate and many more. For the full listing of all dairy statistics and see how your county performed against the others see the ICBF website or click Here.