Dairy Evaluation Results

Below is a lists of tables with proofs and related information for bulls from the most recent genetic evaluation.  All proofs have been published via the central database. As usual, ranking of bulls has been based on the EBI. The files however contains more detailed information about the bulls (e.g. pedigree information). proofs for Irish bulls (with Irish AI code and daughters milking) have been separated from Foreign bulls to make it easier to search through the list. All tables contain proofs for production, linear type, calving interval and survival traits where available.

Getting proofs for Individual bulls

Searching for individual bulls is now possible for all bulls. There are options to search for bulls either by their Irish AI code (if they have one) or by the last 6 digits of their herd-book number. It is also possible to search for a bull using the name. Click here to search for individual bulls

Bull proofs for Farm Management Software Owners (September 2025)

The file with the latest proofs for AI bulls suitable for the farm management software is now available for download. Two versions of this file are now available. The one suitable for you depends on the package. To download any of these files, please click the right mouse button over the version you want and choose the option ‘Save target as’ to download the file to a directory of your choice in your PC.

IFC Version has linear scores already multiplied by 100 (no decimal place). This includes new bull codes of length 6

======================================================================

Bull proofs (September 2025)

All bulls (September 2025)

EBI Percentiles

Count of Records in ICBF Evaluations

What is EBI?

The Economic Breeding Index (EBI) is a single figure profit index aimed at helping farmers identify the most profitable bulls and cows for breeding dairy herd replacements. It comprises of information on eight sub-indexes related to profitable milk production. 

  1. Milk Production
  2. Fertility
  3. Calving Performance
  4. Beef Carcass
  5. Carbon
  6. Health
  7. Maintenance – Click here to access a Maintenance Sub Index ‘Ready Reckoner’ 
  8. Management

Milk production and fertility are the two most valuable indexes. For example, the milk production sub-index constitutes 33% of the EBI. Different traits measure each sub-index, and these traits are multiplied by economic values to generate a Euro value. These Euro values are then summed to generate an overall EBI figure.

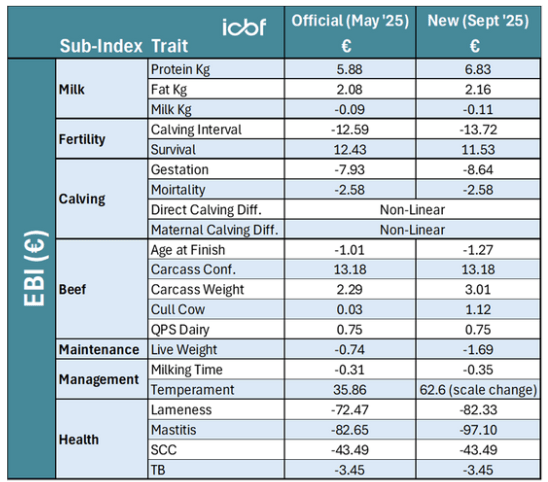
Updated Economic Values September 2025

Based on the latest data regarding economic values and costs of milk production in Ireland, Teagasc have updated the economic values used in the EBI. These updates account for rising input costs, such as increased feed and fertiliser prices, higher output prices and future market projections.

The most notable changes will be seen in the Beef and Maintenance Sub-Indexes due to the increased economic value of beef and rising feed costs.

Also, the heifer rearing cost has been moved to the Maintenance Sub-Index which was previously accounted for in the Beef Sub-Index. A Maintenance Sub-Index ‘Ready Reckoner’ with the September 2025 Maintenance Sub Index and the Predicted Mature Cow Liveweight can be found here.

What does PTA mean?

PTA stands for ‘Predicted Transmitting Ability‘. It tells us how much of a trait—like milk yield or fertility—a cow is likely to pass on to her calves.
Just like people inherit traits from their parents, calves inherit traits from their mother and father. The PTA helps farmers predict how good a cow’s offspring will be in terms of specific traits.

Every animal has a genetic potential, called a breeding value. Since a cow only passes on half of her genes to her calves, we use half of the breeding value—and that’s the PTA (the expected difference between the offspring of that animal and the base cow)
PTAs are based on the cow’s genetics and are compared to a “base cow,” which has an Economic Breeding Index (EBI) of €0.

What is the Base Cow?

In genetic evaluations, a base is simply the reference group we compare all animals against. Think of it as the “starting line.” Each cow or bull’s genetic merit, or Predicted Transmitting Ability (PTA), is measured relative to this base group.

Over time, the genetic potential of herds improves due to selective breeding. This means that today’s cows are, on average, genetically superior to the older base population of cows. To reflect the genetic improvements made in milk production and fertility in the Irish dairy herd, the base cow against which EBI is measured has been updated as part of the September 2025 evaluation.

To make comparisons fair, all animals are compared to the same “base cow,” which is a real group of cows used as a reference point. Think of it as the “starting line.” These cows have a PTA of zero. So when you see a PTA value, it shows how much better or worse an animal is compared to that standard. Each cow or bull’s genetic merit, or Predicted Transmitting Ability (PTA), is measured relative to this base group.

Example: if a sire has a PTA of +10 kg for fat yield and is mated to a base dam (PTA = 0 kg), his progeny are expected to yield, on average, 10 kg more fat than the base population if producing in the average environment.

Over time, the genetic potential of herds improves due to selective breeding. This means that today’s cows are, on average, genetically superior to the older base population of cows. To reflect the genetic improvements made in milk production and fertility in the Irish dairy herd, the base cow against which EBI is measured has been updated as part of the September 2025 evaluation.

  • The old base cow was using cows born in 2005, first calved and milk recorded milk recorded in the 2007- 2009 period.
  • The new base will use cows born in 2015, first calved and milk recorded in the 2017-2019 period

Dairy Base Cow (Milk Production & Fertility)

MetricMilk Yield Fat Kg Protein Kg Fat % Protein %Calving Interval Survival
Cow Base 6,2872642264.2%3.6%385 days85.6%

For example, if a cow has an EBI of €100, it means she is genetically better than the base cow, and her calves are expected to be €100 more profitable over their lifetime.

What can farmers expect to see as a result of the September 2025 base change?

The updated base will result in each animal’s EBI reducing by €97.

Updating the genetic base is just a reset of the starting line — it keeps evaluations up to date with today’s cows, but it doesn’t change the ranking of bulls or cows. While the PTA figures for all animals shift up or down, they all shift by the same amount.

2024 Key Performance Indicators  

2024 Key Performance Indicators in Dairy Herds

KPI Metric (2024)Btm 20%AverageTop 20%Diff.
Average EBI€117€177€234€57
Herds2,60613,8792,606
Dairy Cows7899143
Milk Litres per Cow4,9665,0845,495411
Butterfat %4.144.314.510.20
Protein %3.433.543.670.13
Kgs Milk Solids / Cow38741146251
SCC206184142-43
Milk Price (cpl)49.050.753.12.35
6-Week Calving Rate60698112
Calving Interval (days)399385372-14
AI Bred Repl. %38599132
Kg CO2 / Kg FPCM1.081.020.93-0.09

How to increase EBI on your farm:

  1. Check your HerdPlus EBI report for the genetic indexes of your herd and identify the traits you wish to improve, focusing particularly on milk production and fertility.
  2. Select a team of bulls from the ICBF active bull list that are on average better that the genetic index for the traits you wish to improve: Click here to view ICBF Active Bull Lists
  3. Focus breeding replacement females from your heifers – breeding heifers to carefully selected high EBI bulls is one of the fastest ways to improve herd EBI and profitability.
  4. The Sire Advice tool can be used to allocate selected bulls to the cows in your herd.

Sire Advice Step by Step Videos