
What Long Calving Intervals Are Costing Beef Herds in 2026
The latest Spring 2026 beef calving statistics reveal a stark contrast between the highest and lowest-performing beef herds. While the top-performing herds are achieving compact calving patterns and strong reproductive efficiency, the bottom 10% are losing significant output through longer calving intervals, delayed heifer calving and lower calf production.
For many farmers, reproductive performance can have a bigger impact on profitability than any single management change. Every extra day a cow remains unproductive, every delayed replacement heifer and every missed calf reduces the efficiency of the breeding herd.
The Spring 2026 figures provide a clear answer to an important question: what is poor fertility costing beef herds?
Long Calving Intervals Are Reducing Herd Output
Among the bottom 10% of herds, the average calving interval reached 505 days.
By comparison, the top 10% achieved an average calving interval of 351 days, while the national average stood at 399 days.
A calving interval of 505 days means cows are taking almost 17 months between calves. Over time, this significantly reduces the number of calves produced from the same breeding herd.
Every extra day between calvings delays the birth of the next calf and increases the cost of maintaining the cow. Feed, land, labour and veterinary costs continue regardless of whether the cow is producing a saleable calf.
In contrast, the top-performing herds are operating much closer to the goal of producing one calf per cow every year.
Just 0.54 Calves Per Cow Per Year
One of the clearest indicators of reproductive performance is calves per cow per year.
The Spring 2026 figures show:
- Top 10%: 1.05 calves per cow per year
- National Average: 0.85 calves per cow per year
- Bottom 10%: 0.54 calves per cow per year
To put this into perspective, a herd with 100 cows operating at the level of the bottom 10% would produce approximately 54 calves annually.
A similar-sized herd performing at the level of the top 10% would produce approximately 105 calves annually.
That represents a difference of 51 calves from the same number of breeding females.
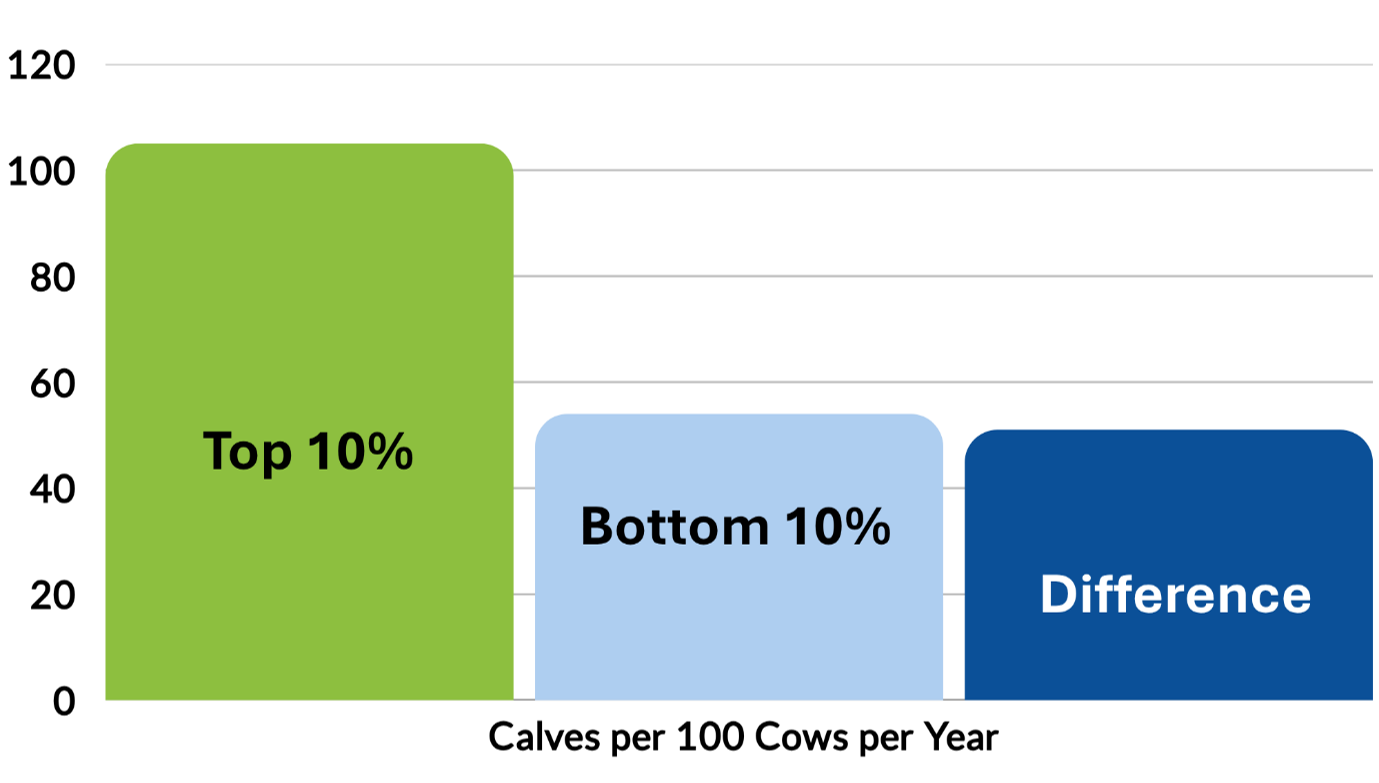
The costs of maintaining the herd are largely fixed, but the output is dramatically different. This illustrates how reproductive efficiency has a direct effect on overall herd profitability.
Delayed First Calving Comes at a Cost
Age at first calving was another area where major differences were evident.
The top 10% of herds achieved an average age at first calving of 23.2 months. The national average was 32.4 months, while the bottom 10% averaged 45.4 months.
This means the poorest-performing herds are carrying replacement heifers for almost two additional years before they produce their first calf.
During this period, those animals continue to consume feed and use valuable farm resources while generating no return for the business.
Earlier calving allows heifers to enter the productive herd sooner, begin generating output earlier and potentially produce more calves over their lifetime.
The Hidden Cost of Delayed Calving
The financial impact of poor reproductive efficiency is not always obvious because the losses occur gradually over time.
A long calving interval may only result in a cow calving a few weeks later each year. A replacement heifer may only be delayed by several months. However, when these delays are repeated across an entire herd, the effect becomes significant.
Poor-performing herds often face:
- Fewer calves available for sale or finishing
- Higher replacement costs
- Greater feed costs per calf produced
- More labour associated with extended calving seasons
- Reduced lifetime productivity from breeding females
Many of these costs are hidden within the system rather than appearing as a single expense. As a result, they can go unnoticed despite having a major impact on overall profitability.
Fertility Performance Creates a Wide Efficiency Gap
The Spring 2026 statistics demonstrate that reproductive efficiency remains one of the biggest factors separating the strongest and weakest beef herds.
These figures highlight how improved fertility can transform herd performance without increasing cow numbers.
Key Takeaway
Poor reproductive efficiency is costing some beef herds far more than they may realise.
Long calving intervals, fewer calves produced per cow and delayed first calving all contribute to lower output and higher costs. The Spring 2026 results show that the most efficient herds are producing almost twice as many calves per cow as the lowest-performing group while bringing replacement heifers into production much earlier.
For beef farmers looking to improve profitability, fertility remains one of the most important areas to monitor. Small improvements in calving interval, replacement management and calf output can have a lasting impact on herd performance.