
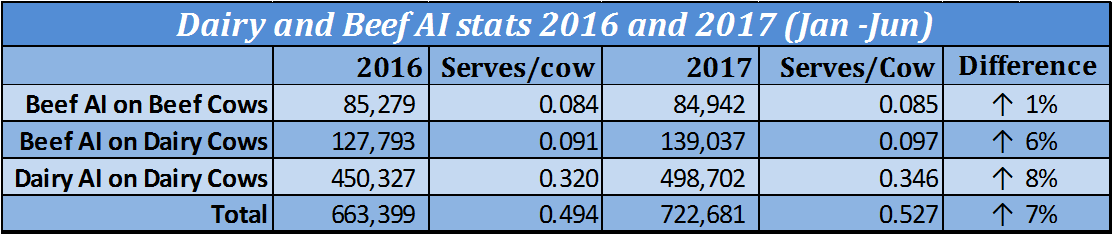
The number of serves per cows recorded on AI handheld devices is up 7% when compared to this time 12 months ago. This figure includes both Dairy and Beef serves.
Dairy Serves up 8%
The number of dairy serves has increased by 48,375 when compared to the same date in 2016. At the end of June 2016 there were 450,327 dairy on dairy handheld serves recorded while at the end of June 2017 this figure was 498,702. This is an increase of 8% (serves per cow % increase) when compared with the same period last year. There has also been an increase of 6% in Beef AI handheld serves recorded on the Dairy herd (See Table 1).
The number of Beef AI serves recorded on a handheld device have remained at a similar figure to this time last year with a slight increase of 1% (serves per cow) (See Table 1). At the end of June 2016 there were 85,279 beef on beef handheld serves recorded while at the end of June 2017 this figure was 84,942.
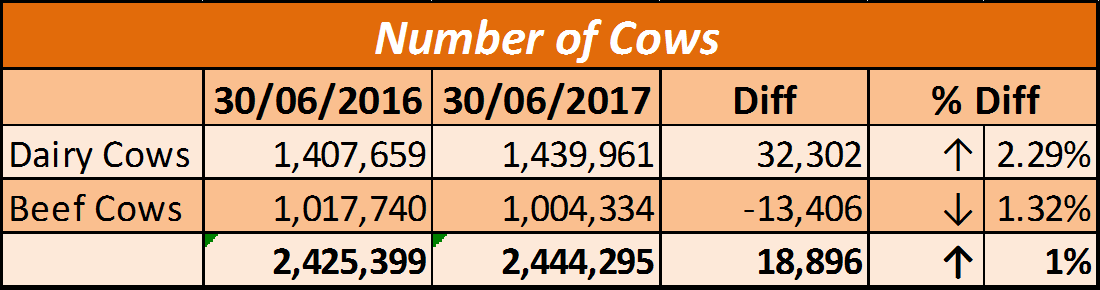
Fewer Beef Cows
The number of beef cows in 2017 (year to date) has reduced by 13,406 when compared to the same date in 2016 (See Table 2). At the end of June 2016 there were 1,017,740 beef cows in the national herd while at the end of June 2017 this figure was 1,004,334. This is a drop of 1.32% when compared with the same period last year.
Meanwhile in contrast with the beef cows, the number of dairy cows in 2017 (year to date) have increased by 32,302 (Table 2) when compared to the same date in 2016. This is an increase of 2.24% when compared with the same period last year. Not only have the number of dairy cows increased, the serves per cow percentage has also increased as mentioned above.
More statistics can be found on the ICBF Statistics page.