
When the Beef Data and Genomics Program was first introduced in 2014/2015, our suckler beef industry was at a low ebb. Calves/cow/year languished at 0.79 cows/calf/year and farmers openly acknowledged that their suckler cows had gone too big and had lost a lot of their milk yield potential, which is so important in the context of profitable weanling production.
As a result of these concerns, the Beef Data and Genomics Program was introduced in 2015 as part of Ireland EU Rural Development Program (2014-2020), with the objective of using genetics/genomics to address the decline in key maternal traits within the National suckler herd and in doing so improve the profitability and carbon efficiency of our National cattle herd. In this paper, we review progress to date in the BDGP, with particular reference to key metrics influencing the profitability and climate efficiency of our suckler herd. These include; (i) maternal traits, (ii) carcass output, (iii) genetic trends and (iv) climate efficiency.
Progress to-date.
At this stage, there are 24k farmers and 550k cows participating in the scheme, representing about 55% of the total suckler beef cow herd. The highlights from the implementation of the scheme to date, can be summarised as follows;
- Significant improvement in key maternal traits. Key metrics such as calves/cow/year, calving interval and age at first calving are all now moving in the right direction (See Table 1). The most notable example is calves/cow/year which has moved from 0.80 in 2014 to 0.87 for 2017, which across the 24k scheme herds represents an additional 40k calves for sale, with a weanling output value of some €30m to the participating beef farmers. Equivalent National figures have moved from 0.79 calves/cow/year to 0.85 calves/cow/year over the same, confirming the impact that the scheme is having on the wider industry.
Table 1. Trends in calving performance for BDGP herds (2014 – 2017).
| Trait | 2014 | 2015 | 2016 | 2017 |
| Calves/cow/year. | 0.80 | 0.84 | 0.85 | 0.87 |
| % heifers calved at 22-26 months. | 17.2 | 19.2 | 21.2 | 25.8 |
| Calving interval (days). | 407 | 399 | 391 | 393 |
| % calving’s with recorded sire. | 78.3 | 80.7 | 92.8 | 89.2 |
- A steady improvement in carcass output from the suckler herd. Despite concerns from some sectors of the industry, analysis of data from meat processors, has highlighted a steady increase in carcass weights from suckler bred animals (Table 2), with no decline in quality over the past 5 years. Furthermore, these animals are being slaughtered at a younger age (minus 22 days on average). Similar trends are apparent for dairy-beef and dairy bred animals. However, this analysis has also highlighted an overall reduction in carcass weight between 2016 and 2017 (down 4.5 kg nationally), but this is then due to the impact of an expanding dairy herd, where carcass weights are significantly lighter (on average 60kg lighter), leading to overall reduction in carcass output/animal for the beef industry.
Table 2. Trends in carcass performance for suckler beef, dairy beef and dairy steers (2014 – 2017).
| Suckler Beef Steers | Dairy Beef Steers | Dairy Steers. | Overall | ||||||||
| Year | Number | % | Cwt | Number | % | Cwt | Number | % | Cwt | Total | Cwt |
| 2013 | 232,433 | 0.46 | 379.1 | 124,413 | 0.25 | 334.7 | 144,619 | 0.29 | 314.3 | 501,465 | 349.4 |
| 2014 | 253,674 | 0.44 | 380.6 | 138,946 | 0.24 | 339.2 | 180,679 | 0.32 | 322.1 | 573,299 | 352.1 |
| 2015 | 281,645 | 0.47 | 388.4 | 142,718 | 0.24 | 342.9 | 180,196 | 0.30 | 325.9 | 604,559 | 359.0 |
| 2016 | 268,683 | 0.45 | 387.2 | 167,002 | 0.28 | 340.9 | 164,643 | 0.27 | 326.1 | 600,328 | 357.6 |
| 2017 | 269,502 | 0.41 | 386.3 | 197,003 | 0.30 | 339.1 | 184,700 | 0.28 | 319.6 | 651,205 | 353.1 |
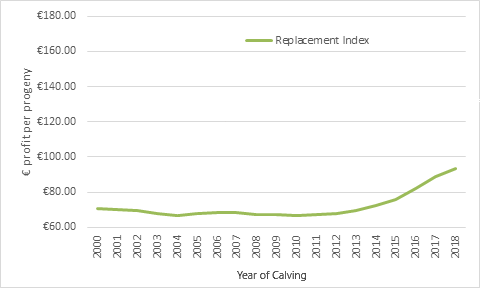
- A reversal in genetic trend for replacement index. After years of decline in key maternal traits, genetic trend for replacement index has now turned around and is generating significant additional gains for participating beef farmers (Figure 1). Already this gain is worth some €80m to participating beef farmers (in terms of current and future profitability from these 4 and 5 star females), with an expectation that this will rise to some €600m by 2030, at which stage the cumulative benefit of the scheme will be fully realised. In addition, the benefits of the scheme is flowing into non BDGP herds, as these herds are also indirectly accruing the benefits of better replacement heifers and breeding bulls as a result of the BDGP.
- Confirmation that 5 star cows are more climate efficient. Validation work undertaken by Teagasc and ICBF on 46 participating commercial beef farms over the past 3 years has confirmed that 5 star cows are; (i) more fertile, (ii) lighter (thereby requiring less feed), (iii) have more milk (i.e., a heavier weanling), (iv) produce a heavier carcass and (v) are more carbon efficient, compared to 1 star cows on the same farms (Table 3). A total of 7,790 cows have been involved in the trial to date, with all cows and calves weighed on these participating farms over the three years of the study. The indexes used for validation, are the replacement index values at the start of the study (Spring 2015) or for more recent replacements, the index value when the heifers were yearlings (i.e., prior to first breeding).
Table 3. Comparison of 5 star and 1 star cows for key metrics relating to profitability, sustainability and climate efficiency.
| Stars | No of Animals | Rep Index | Life CO2e* | AFC (days) | CIV (days) | Cow lwt kg | Wean wt kg | Progeny Cwt kg | Progeny age slau |
| 5 star | 2,181 | €130 | 17,085 | 860 | 375 | 664 | 311 | 374 | 604 |
| 4 star | 1,881 | €87 | 17,260 | 862 | 376 | 672 | 305 | 373 | 606 |
| 3 Star | 1,984 | €58 | 17,378 | 881 | 377 | 684 | 299 | 370 | 605 |
| 2 Star | 1,020 | €31 | 17,484 | 887 | 377 | 689 | 296 | 364 | 605 |
| 1 Star | 724 | -€6 | 17,635 | 896 | 383 | 737 | 285 | 361 | 610 |
| Diff | €136 | -550 | 36 | 8 | 73 | 26 | 13 | -6 | |
| Pvalue | *** | * | *** | *** | *** | NS |
* Based on Gross Emissions Output over the cows lifetime. Includes emissions from the cow and her progeny.
The results presented in table 1 clearly indicate the accuracy of the €uro-Star system as a means to identify cows that will produce “more from less”, which is completely consistent with the objectives of the scheme.
Other points of note.
There are a number of other points of note that are relevant to the implementation of the scheme at this stage. These include;
- Movement in stars. The movement in star ratings are completely consistent with expectations, with 75% of the 4 &5 star parity 1 females (95,268 in total) at the start of the scheme (May 2015 evaluation), still 4 & 5 stars some 3 years later. In fact, only 1% of these animals have moved from 5 star to 1 star (and vice versa), with the majority these due to pedigree changes as a consequence of genotyping. This should give farmers further confidence that by selecting replacement females based on genomic replacement index, then they can be confident that these animals will deliver additional profit in the future, as outlined in Table 3.
- Use of non-pedigree bulls. Scheme participants are focused on ensuring that when purchasing breeding males, they maximise the accuracy of their selection decision. As a result less than 1% of the 15,638 breeding males on BDGP farms (with a registered progeny) are non-pedigree bulls, which is consistent with ICBF’s strategy of delivering genetic improvement within each of the relevant breeds, through programs such as Whole Herd Performance Recording (WHPR) and G€N€ IR€LAND.
- Use of dairy bred stock. Again contrary to some view expressed in some quarters, the % of 1st crosses from the dairy herd entering the suckler herd as replacement females has actually declined over the last number of years from 26% in 2012 to 23% for 2017. Again, this confirms that scheme participants are preferring to use genomics within their own herds to select their replacement females.
In summary, it is most reassuring to see maternal traits now improving in the National suckler herd, along with the continued gains in terminal traits. On that basis, it is becoming clear that the scheme is an an excellent example of success for DAFM, ICBF, Teagasc, the beef breeding industry and beef farmers.